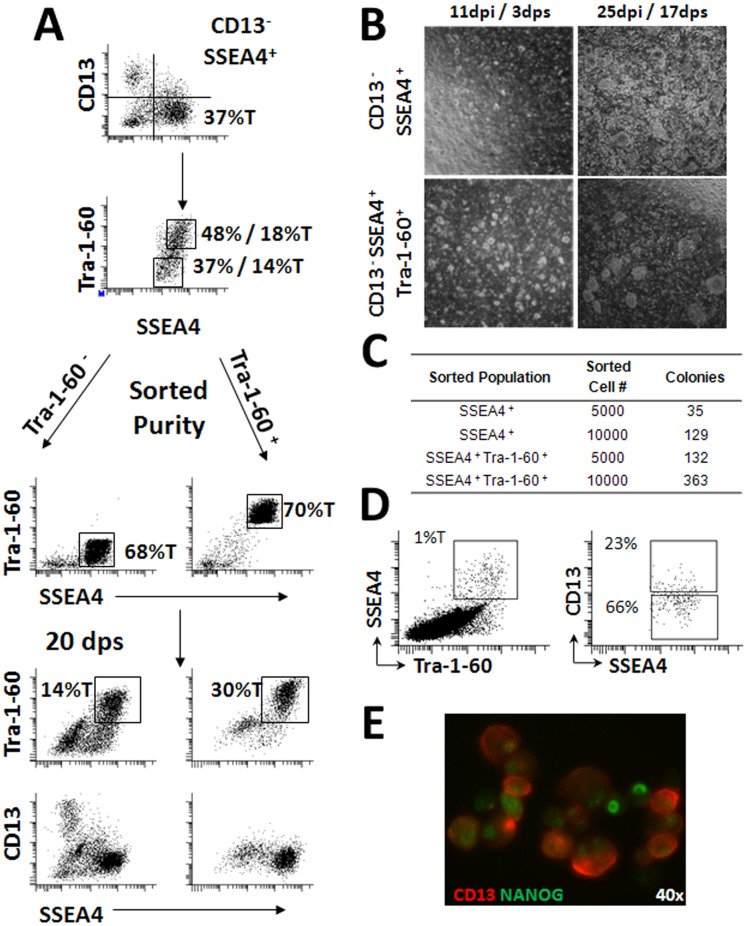
Figure 1. Enhanced derivation and maintenance of virally reprogrammed fibroblasts using Fluorescence Activated Cell Sorting.
(A) CD13NEGSSEA4POSTra-1-60NEG and CD13NEGSSEA4POSTra-1-60POS populations from the manually derived 1018 clone were sorted onto MEF feeder layers and expanded for 20 days prior to reanalysis by flow cytometry to assess retention of sorted surface markers. dpi = days post infection. dps = days post sort. (B) CD13NEGSSEA4POS and CD13NEGSSEA4POSTra-1-60POS populations were sorted onto MEF layers at seven days post infection and imaged at 3 and 17 dps to assess colony formation. (C) Colony counts arising from the sorted cell populations shown in Panel B at 17 dps (25 dpi). (D) Gating structure used in the analysis of CD13POS cells present within the SSEA4POSTra-1-60POS population at 7 dpi. (E) Fluorescence microscopy demonstrating NANOG expression in CD13POS cell at 7 dpi. 40× magnification. CD13 shown in red. Nanog in shown Green. Values designated %T indicates proportion of total cells within the culture positive for the indicated combinations of surface markers. Values without T designation indicate the proportion of CD13NEGSSEA4POS cells that are Tra-1-60POS or Tra-1-60NEG in Panel A and D.

