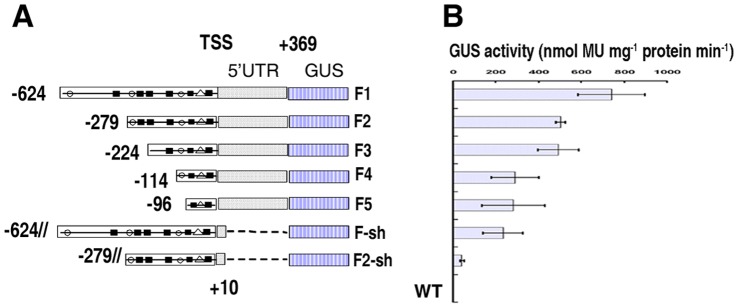
Figure 4. Schematic presentation of the GbSLSP promoter 5′-and 3′-deletion series.

A, Schematic diagrams of deletion series constructs. Solid round (•), the (T/A)AAAG elements on sense strand (5′ to 3′); Solid square (▪), (T/A)AAAG elements on antisense strand (3′ to 5′); White triangle (△), TATA-box. B, Quantitative analysis of GUS activity from the deletion series in T0 transgenic tobacco leaves. Values represent mean and standard error.
