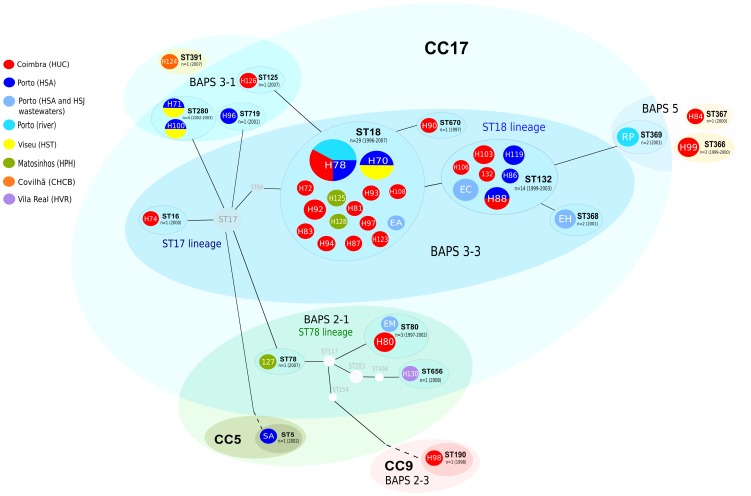
Figure 1. Population of vancomycin resistant Enterococcus faecium.
Abbreviations: ST, sequence types; CC, clonal complex; BAPS, Bayesian Analysis of Population Structure; HUC, Hospital Universitário de Coimbra; HSA, Hospital Santo António; HSJ, Hospital São João; HST, Hospital São Teotónio; HPH, Hospital Pedro Hispano; CHCB, Centro Hospitalar da Cova da Beira; HVR, Hospital S. Pedro. A colored circle represents each PFGE type (white numbers/letters; H for hospital, SW for sewage, R for river and S for swine clones) and each PFGE type is associated with the corresponding sequence type (STs are represented in black letter and in colored elipses grouping different PFGE types) and BAPS group (in colored elipses grouping different STs). The size of the colored circles corresponds to the number of isolates. CC17 (in light blue), CC5 (in light green), CC9 (in light red) and the singletons ST366, ST367 and ST391 (light yellow) are represented according to the eBURST algorithm (download on 26th January 2012) with black lines joining single locus variants (SLV). STs that were not identified in this study are represented as light grey nodes to link the sequence types identified in this study accordingly to eBURST. ST18 strains (H70, H78, H87, H93, H108, H125) and most ST132 strains (H86, H88, H106, SWC) were clonally related by PFGE (< 7 bands difference). Remarkable relationships among PFGE banding patterns of strains belonging to different STs were observed (H125/ST18 and H126/ST125; H124/ST391 and H71/ST280, SWM/ST80 and H86/H88/H106/H119/SWC/ST132, and isolates SWA/ST18 and SWC/ST132 (< 8 bands difference). This figure drawn up was performed in the “Open Source vector graphics editor Inkscape” (version Inkscape-0.48.2–1).

