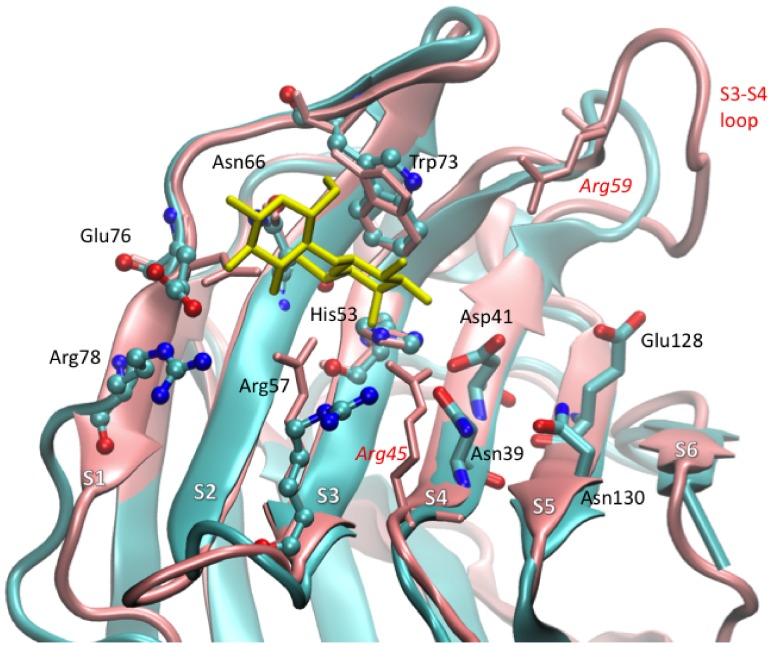
Figure 2. Superimposition of Gal-8N and -C domain.
Ribbon representation of superimposed Gal-8N and -C domain. The N domain is shown in pink color code whereas the C domain is in cyan. Lactose is shown as stick model in yellow color. The variable loop between S3–S4 shows difference in length between Gal-8C and -N.

