
Figure 1.
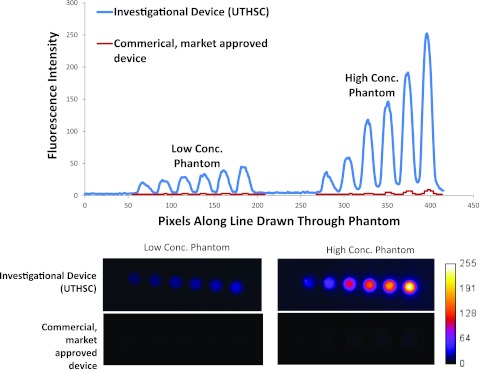
(Top) Intensity values read from images of low and high concentration as acquired from the investigational device (upper curve) at optimized settings for clinical imaging (converted to 8 bit to enable comparison) and from the commercial, market-approved device (lower curve) at factory settings for clinical imaging. (Bottom) Unprocessed image files for low concentration (pM) and high concentration (nM) quantum dots captured by investigational and commercial, market-approved devices from which intensity values in plot above are drawn. The SNR for the phantom with the highest concentration of quantum dots was 36 for the investigational device and 11 for the commercial, market-approved device. These comparisons are not made to claim superiority of one device over another, but rather to point out the variability of detection limits and sensitivity that could reflect differences in device performance in the clinical setting. Specifications of the commercial, market-approved device were not available to understand the causes of the differences in task-specific, imaging performance. We measured the incident excitation light fluence at the operational tissue surface of the commercial, market-approved device was approximately 12 mW/cm2, while that of the investigational device was less than 1/10 of that value.