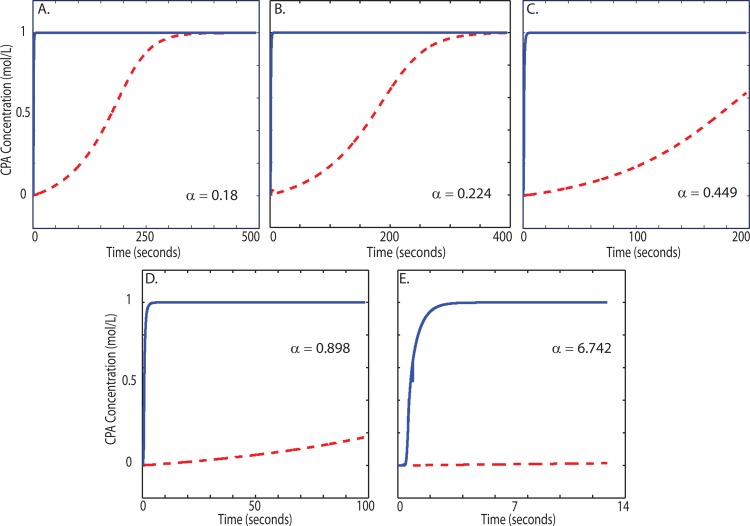
Figure 7.
Transient concentration profiles for one representative particle out of the 250 particles tracked. The solid line showsthe extracellular CPA concentration; the dashed line shows the intracellular CPA concentration. Each plot displays a different value of α, showing how this parameter changes the final CPA loading. As α increases, the loading moves further from completion. The α values correspond to flow rates of: (a) 0.08 μl/min, (b) 0.1 μl/min, (c) 0.2 μl/min, (d) 0.4 μl/min, and (e) 3 μl/min.

