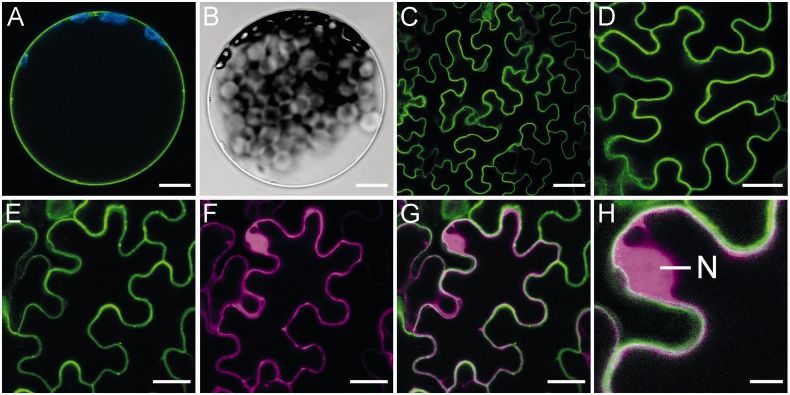
Fig. 4.
Localization of CNGC20 and CaM2. Fluorescence of CNGC20 GFP fusion proteins in (A–H) is shown in green. (A and B) CNGC20–GFP expressed in N. benthamiana protoplasts. Chloroplast fluorescence is shown in blue. (B) Bright field image corresponding to A. (C–H) Tobacco epidermal cells expressing (C) CNGC20–GFP, (D) GFP–CNGC20 and (E–H) CNGC20–GFP in addition to CaM2–mCherry. mCherry fluorescence is shown in magenta. (E) Green fluorescence; (F) red fluorescence; (G) overlay image of (E) and (F); (H) higher magnified detail of (G). An N labels the position of the nucleus, where the nucleoli can be identified as areas of reduced fluorescence. Bars represent 10 µm (A, B), 50 µm (C), 30 µm (D), 20 µm (E–G) and 5 µm (H).

