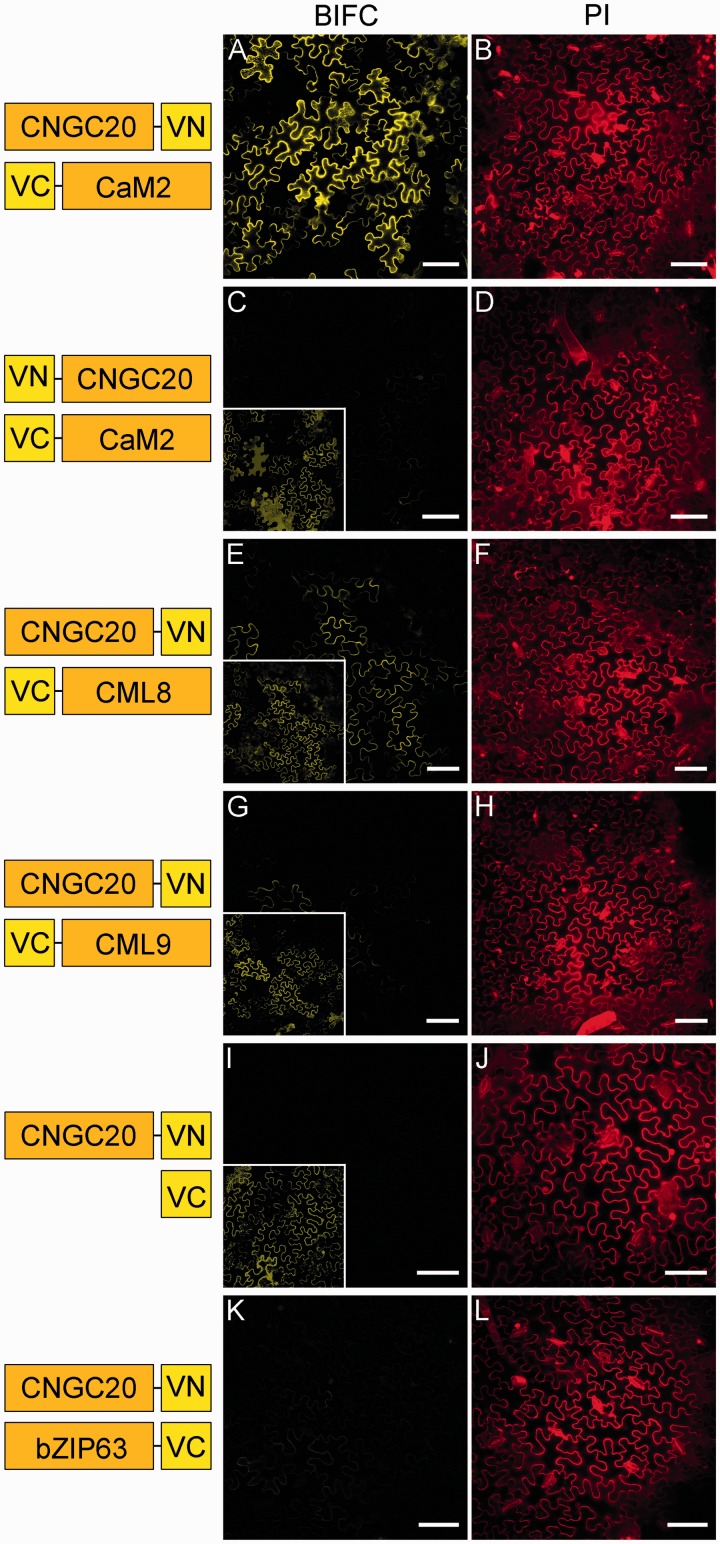
Fig. 6.
CNGC20 interacts with CaM at the plasma membrane. (A–L) Images of BiFC signals (yellow, middle column) and propidium iodide (PI) staining (red, right column) in tobacco epidermal cells after co-expression of CNGC20 fused to the N-terminal part of Venus (VN) and the interaction partners fused to the C-terminal part of Venus (VC). Co-expression partners for each experiment are depicted in the left column. Bars represent 75 µm. Vector containing VC only (I) and bZIP63–VC (K) were used as negative controls. For comparison of the BiFC signal intensities, corresponding images were taken with the same laser intensities, photomultiplier settings and magnification, and were equally processed. Insets show the same images adjusted with different tonal values, brightness and contrast, in order to enhance the low signal intensities.

