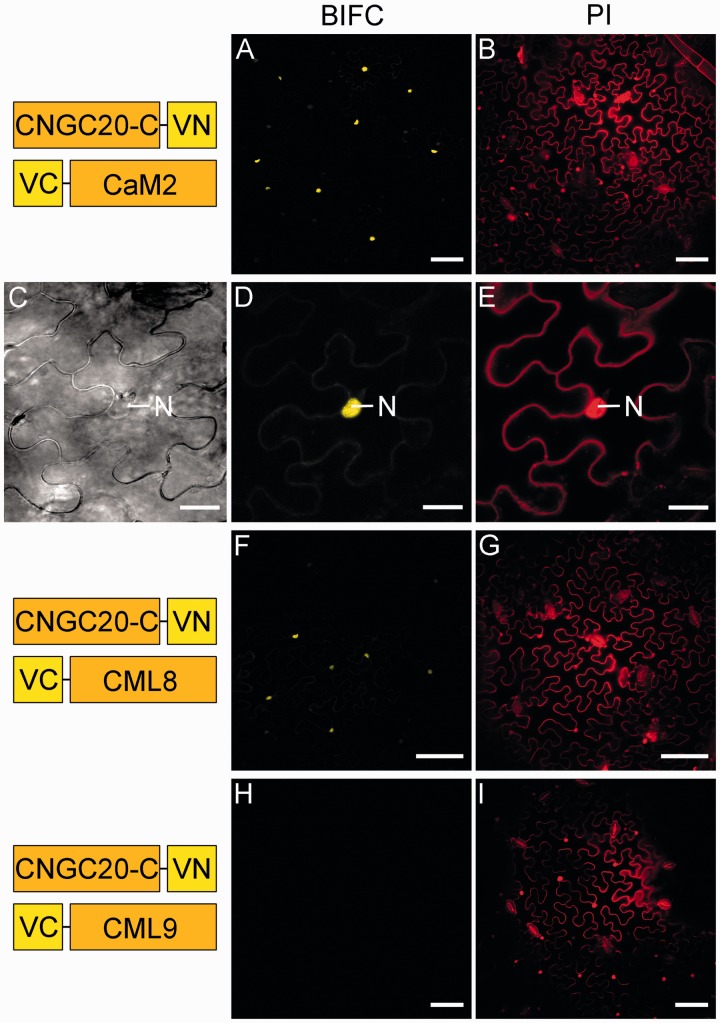
Fig. 7.
The C-terminus of CNGC20 interacts with CaM in the nucleus. Layout and experimental set-up as described in Fig. 6. BiFC signals indicate the interaction between the C-terminus and CaM2 in the nucleus (A, D). (C–E) Co-expression partners as in (A) were used and corresponding images for bright field (C, trimmed width), BiFC signals (D) and PI staining (E) are shown at a higher magnification, where the nucleus is clearly detectable in each image. Bars represent 75 µm, and in (C–E) 20 µm.

