
Figure 3.
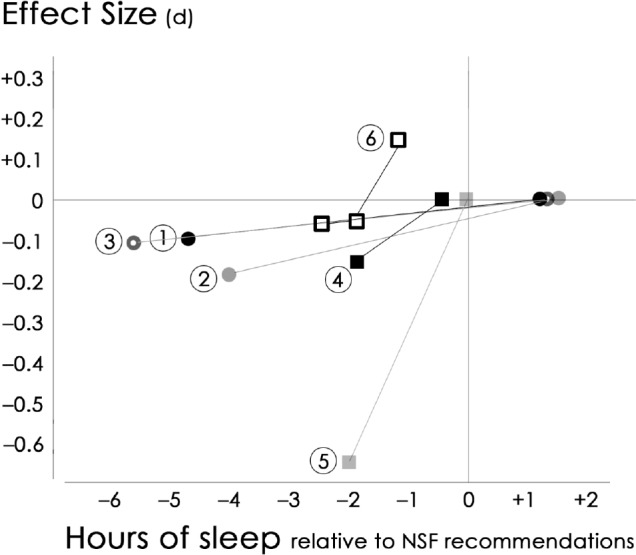
Mean effect size changes (relative to best performance) after sleep restriction/extension in six studies. The horizontal axis shows the hours of sleep relative to National Sleep Foundation (NSF) recommendations; the vertical axis shows the mean effect size difference in outcomes. 1, Carskadon et al., 198167; 2, Randazzo et al., 199826; 3, Fallone et al., 200127; 4, Gruber et al., 201168; 5, Berger et al., 201169; 6, Sadeh et al., 2003.25