Fig. 2.
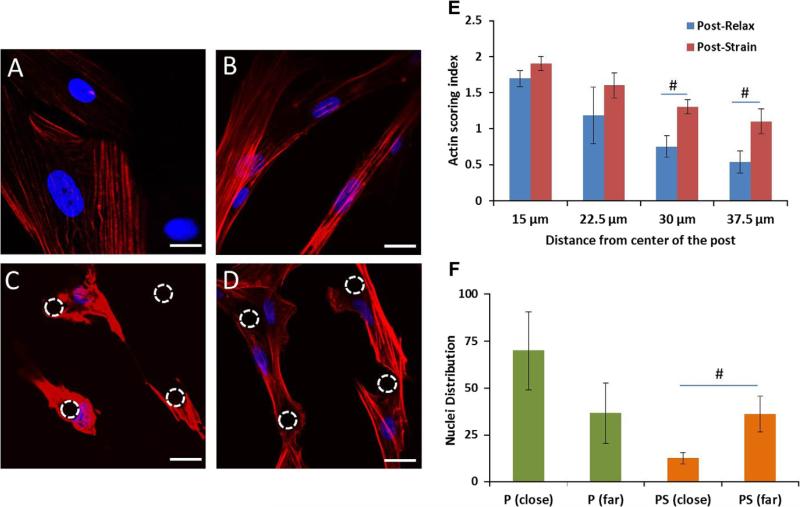
Actin remodels with microtopography and strain. Actin cytoskeleton and nuclei of hMSCs (A) flat, (B) flat-strain, (C) post, and (D) post-strain, seen with confocal microscopy after two days of strain at 1 Hz and 10%. (C) The cells containing actin fibers are wrapped around the post. (D) The actin fibers are elongated in the cells and span from post to post. (E) Frequency histogram of actin distribution at 15, 22.5, 30 and 37.5 μm from post center. (F) Nuclear distribution shifted from close to far regions from a post with cyclic strain. The dashed circles indicate the location of post. Actin stained by rhodamine phalloidin (red); nuclei with DAPI (blue). Mean ± SE, n = 3 human samples, *All vs. flat (control), #close vs. far p < 0.05. Scale bar, 20 μm. (For interpretation of the references to color in this figure legend, the reader is referred to the web version of this article.)

