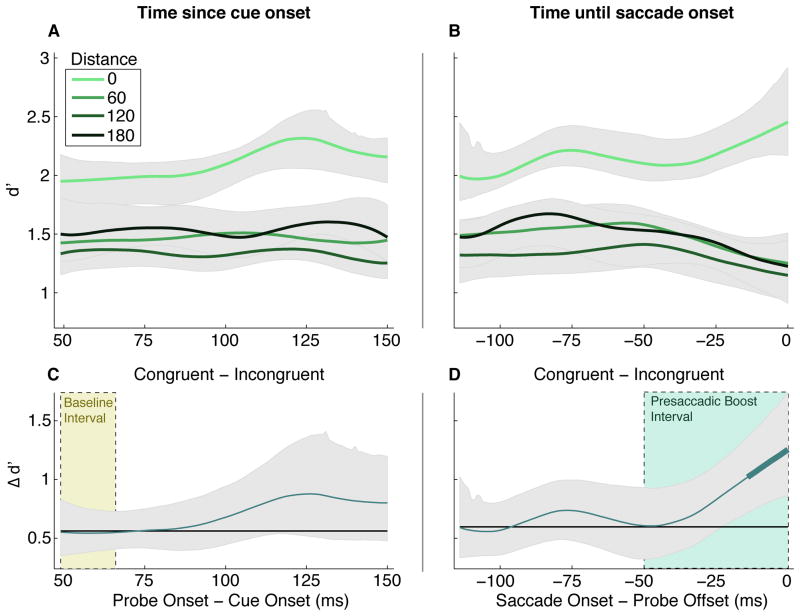
Figure 3.
Temporal dynamics of pre-saccadic spatial attention. Left Panels (A and C): Sensitivity as a function of time between cue onset and probe onset. Right Panels (B and D): Sensitivity as a function of time between probe offset and saccade onset. Top panels (A and B): Each solid line represents one probe-target distance, indicated by the legend on the left. Shaded regions are 95% confidence intervals from bootstrapping. Bottom panels (C and D): The difference between performance at the saccade target (congruent) and elsewhere (incongruent), relative to the magnitude of that difference (black line) in the Baseline Interval containing the earliest 100 trials. Thicker points indicate significant change from the early baseline.

