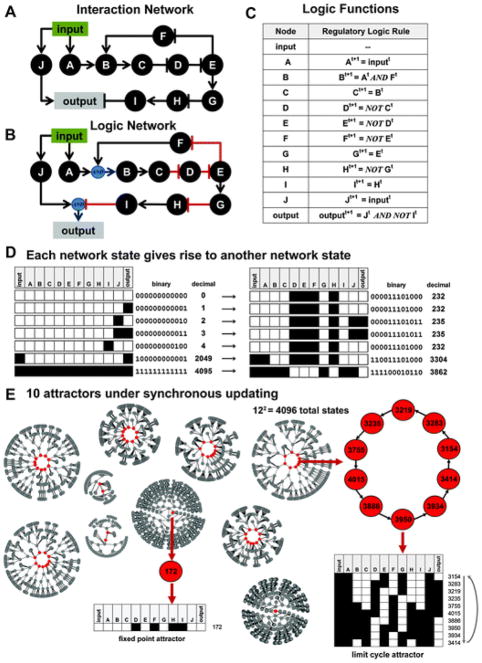
Fig. 2.
Hypothetical network example with 12 nodes. (A) An interaction network diagram summarizing a hypothetical network with 12 nodes where input is the only input node, output is the only output node, and A–J are internally regulated nodes. (B) A logic network diagram explicitly identifying how multiple signals (edges in the diagram) will be integrated to produce a response in nodes Band output, the only nodes with more than one regulator. (C) A table explicitly listing the logic functions used in the hypothetical logic model. The information in this table is equivalent to the information available in (B), and both (B) and (C) contain more information than (A). (D) Each unique network state in a logic network can be identified in a number of ways: a graphical table where white = OFF and black = ON, a binary representation where 0 = OFF and 1 = ON, or a decimal value that is equivalent to the binary representation. Each of these states will give rise to another state based on the logic functions (B–C) that control signal transfer in the network. (E) Eventually, all states will settle into an attractor, a state from which it is not possible to escape without an external perturbation to the system. In the graphs, attractor states are colored red and non-attractor states are colored grey. An example of a limit cycle and a fix point attractor are highlighted. In this model, there are a total of 212(4096) possible states that settle in to 1 of 10 attractors. Blue circles indicate AND interactions.

