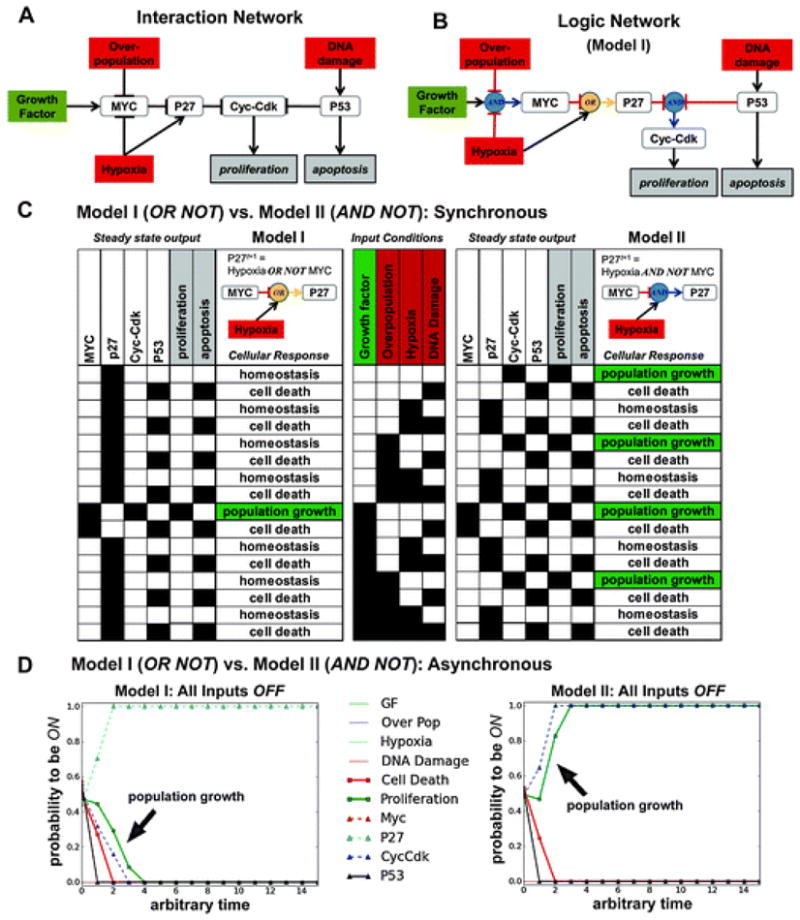
Fig. 5.

A Model of Normal Cell Proliferation and Apoptosis: OR NOT vs. AND NOT. (A) An interaction network diagram depicting regulation of cellular proliferation and apoptosis based on a model published by Ribba et al.54 Overpopulation, Growth Factor, Hypoxia, and DNA Damage are the input nodes and proliferation and apoptosis are the output nodes. The four internally regulated nodes are colored white. (B) Logic network describing the logic functions used in Model I (see also Table 1). (C) The 10 nodes in this network produce a total of 210 (1024) possible states, each of which settles into 1 of 16 possible attractors (identified as steady state output in the table), under a synchronous updating scheme. The 16 possible input conditions are displayed in the center table. On the left, Model I output is presented (with P27 regulated by OR NOT) and, on the right, Model II output is presented (with P27 regulated by AND NOT). (D) Comparison between asynchronous attractors produced by Model I and Model II when all input nodes are OFF. This input condition corresponds to the first row in the synchronous scheme’s table. An asynchronous random order update was repeated 200 times for 15 time steps. Each curve shows the average value of a node after 200 simulations for each time point. Blue circles indicate AND interactions and yellow circles indicate OR interactions.
