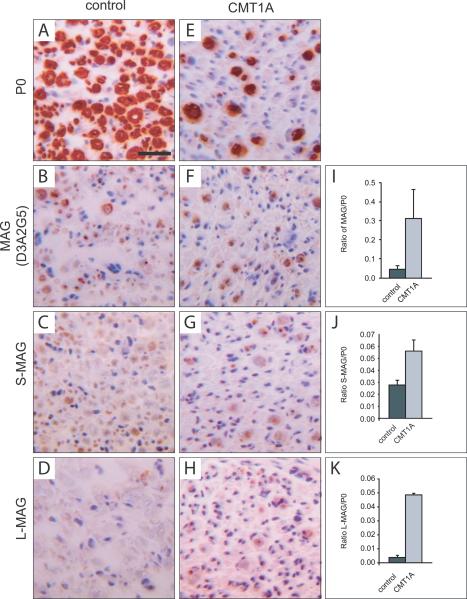
Figure 1. MAG is induced in CMT1A patients.
Transversal sections from sural nerves of control autopsies (A–D) and CMT1A biopsies (E–H) stained for P0 and MAG. Isoform specific antibodies recognizing S-MAG (C, G) or L-MAG (D, H) and an antibody recognizing both isoforms (B, F) were used. In CMT1A patients, the number of myelinated P0 positive fibers was reduced (E). However, the ratio of MAG-positive area relative to P0 positive area was higher in CMT1A patients than in control cases (I–K). The results of the quantitative measurements are expressed as mean and standard error of the mean (s.e.m.) in the bar graphs (single values are given in Supplementary Figure 1I). Scale bar: 20 μm.

