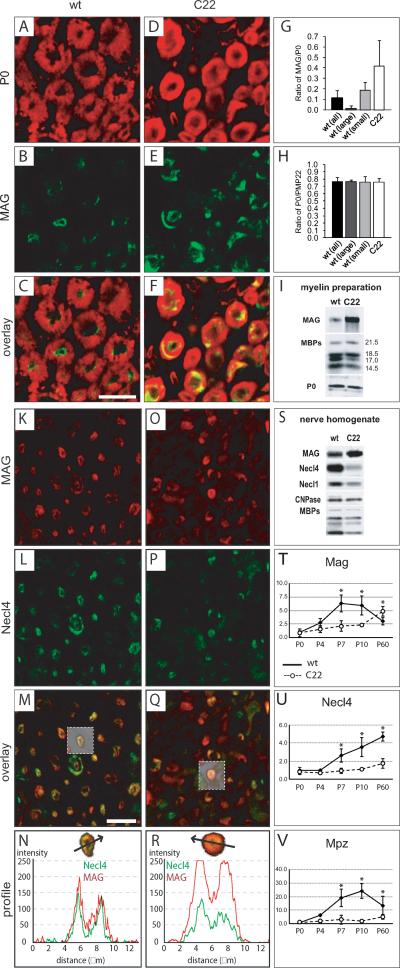
Figure 3. MAG is increased and Necl4 reduced in a CMT1A animal model.
Transversal sections from sciatic nerves of P60 wildtype (A–C) and C22 mice (D–F) stained for P0 (A, D) and MAG (B, E). The ratio of MAG/P0-positive areas was calculated from 50 large (>5μm) as well as 50 small (<5μm) caliber fibers in a wildtype and 50 small caliber fibers in a C22 animal, depicting an increase of MAG in C22 myelinated fibers (G). Investigation of the ratio of PMP22/P0-positive area did not reveal any differences (H). Western blot analysis of myelin membrane preparations revealed increased MAG levels in myelin membranes of sciatic nerves from five months old C22 mice (I). Scale bar: (A–F) 10μm. Immunofluorescent confocal colocalization of transversal sections from sciatic nerves of P60 wildtype (K–M) and C22 mice (O–Q) for MAG (K, O) and Necl4 (L, P) revealed a strong decrease of Necl4 in sciatic nerves from C22 mice (P). MAG and Necl4 were colocalized at periaxonal regions in wildtype (m, n) as well as in C22 mice (Q, R). Analysis of fiber profiles revealed an altered ratio of immunofluorescence for MAG and Necl4 at the periaxonal region in C22 mice (M, Q) resembling the observations from in CMT1A patients. Western blot analysis of sciatic nerve tissue extracts from six months old wildtype and C22 mice showed that the protein levels of both Necl4 and Necl1 were strongly reduced in nerve extracts of C22 mice in contrast to MAG (S). Additionally, a reduction of the myelin protein MBP was detected in extracts of C22 mice, whereas comparable expression levels could be detected for CNPase (S). Note that the increased MAG expression in C22 was less pronounced in whole nerve protein extracts than in myelin membrane preparations (I). Quantitative RT-PCR was performed for Mag (T), Necl4 (U) and Mpz/P0 (V) at P0, P4, P7, P10 and P60 from wildtype (closed squares) and C22 (open circles, dashed line) mice. The mRNA expression levels were normalized to 60S expression and to its wildtype P0 level, which was set to 1. Significant differences (p<0.05) are indicated with an asterisk. Expression data are shown as mean and s.d. Scale bar: (K–Q) 20 μm.

