Figure 1.

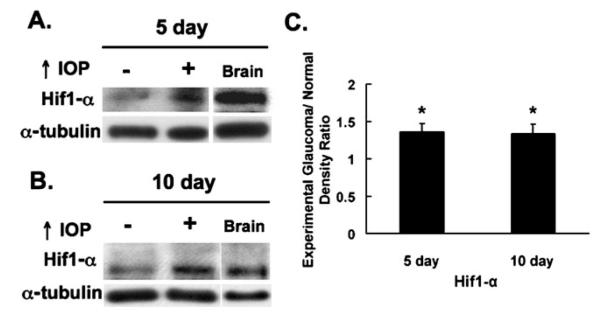
Western blotting: HIF-1α levels are increased in the glaucomatous retina compared to controls. a HIF-1α expression after 5 days of elevated IOP (n=6). A band for HIF-1α was detected between 100 and 150 kDa in the control and glaucomatous retinas as well as in the positive control brain. HIF-1α levels were elevated in the glaucomatous retinas compared to controls. b HIF-1α expression after 10 days of elevated IOP (n=6). Similarly, HIF-1α was detected between 100 and 150 kDa in the control and glaucomatous retinas. HIF-1α expression remained elevated in the glaucomatous retinas compared to controls. c Glaucomatous/control ratios of HIF-1α levels in the retina. HIF-1α levels were significantly increased in the glaucomatous retinas compared to controls (P=0.009 for the 5-day group and P=0.021 for the 10-day group). Fold increase was (mean ± SEM) 1.37±0.11 and 1.34±0.13 after 5 and 10 days of elevated IOP, respectively. Positive control: brain, loading control: α-tubulin
