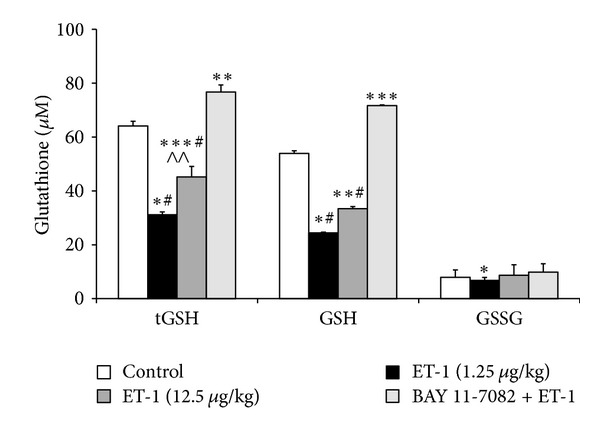
Figure 1.

Liver status of the glutathione metabolism in the control group, the endothelin-1 groups, (1.25 and 12.5 μg/kg/b.w.) and BAY 11-7082 (10 mg/kg b.w.) administered 1 hour before ET-1 (12.5 μg/kg b.w.) group (n = 8, per group). Data is shown as mean ± S.E.M. ET-1-endothelin-1 at doses of 1.25 and 12.5 μg/kg b.w.; BAY+ET-1-BAY 11-7082 (10 mg/kg b.w.) administered 1 hour before endothelin-1 (12.5 μg/kg b.w.) group; tGSH-total glutathione; GSH-reduced glutathione; GSSG-oxidized glutathione.*P < 0.001,**P < 0.01, ***P < 0.02, and ****P < 0.05 versus saline; # P < 0.001, ## P < 0.01, ### P < 0.02, and #### P < 0.05 versus BAY 11-7082 + ET-1; ∧ P < 0.001, ∧∧ P < 0.01 versus ET-1 (1.25 μg/kg b.w).
