
Figure 2.
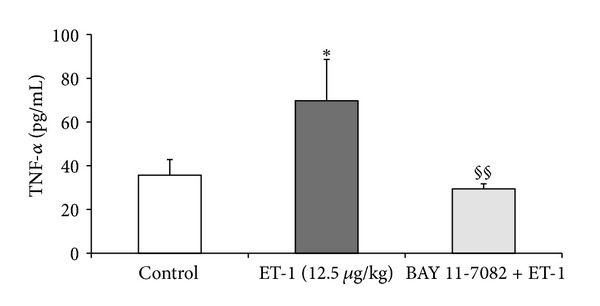
TNF-α concentration in liver homogenates in the control group, after endothelin-1 (1.25 and 12.5 μg/kg b.w.) and BAY 11-7082 + endothelin-1 (10 mg/kg b.w. and 12.5 μg/kg b.w., resp.) group. (n = 8, per group). Data is shown as mean ± S.E.M. ET-1-endothelin-1 at doses of 1.25 and 12.5 μg/kg b.w.; BAY+ET-1-BAY 11-7082 (10 mg/kg b.w.) administered 1 hour before ET-1 (12.5 μg/kg b.w.) group; TNF-α-tumor necrosis factor; §§ P < 0.01 versus ET-1 (12.5 μg/kg).