
Figure 5.
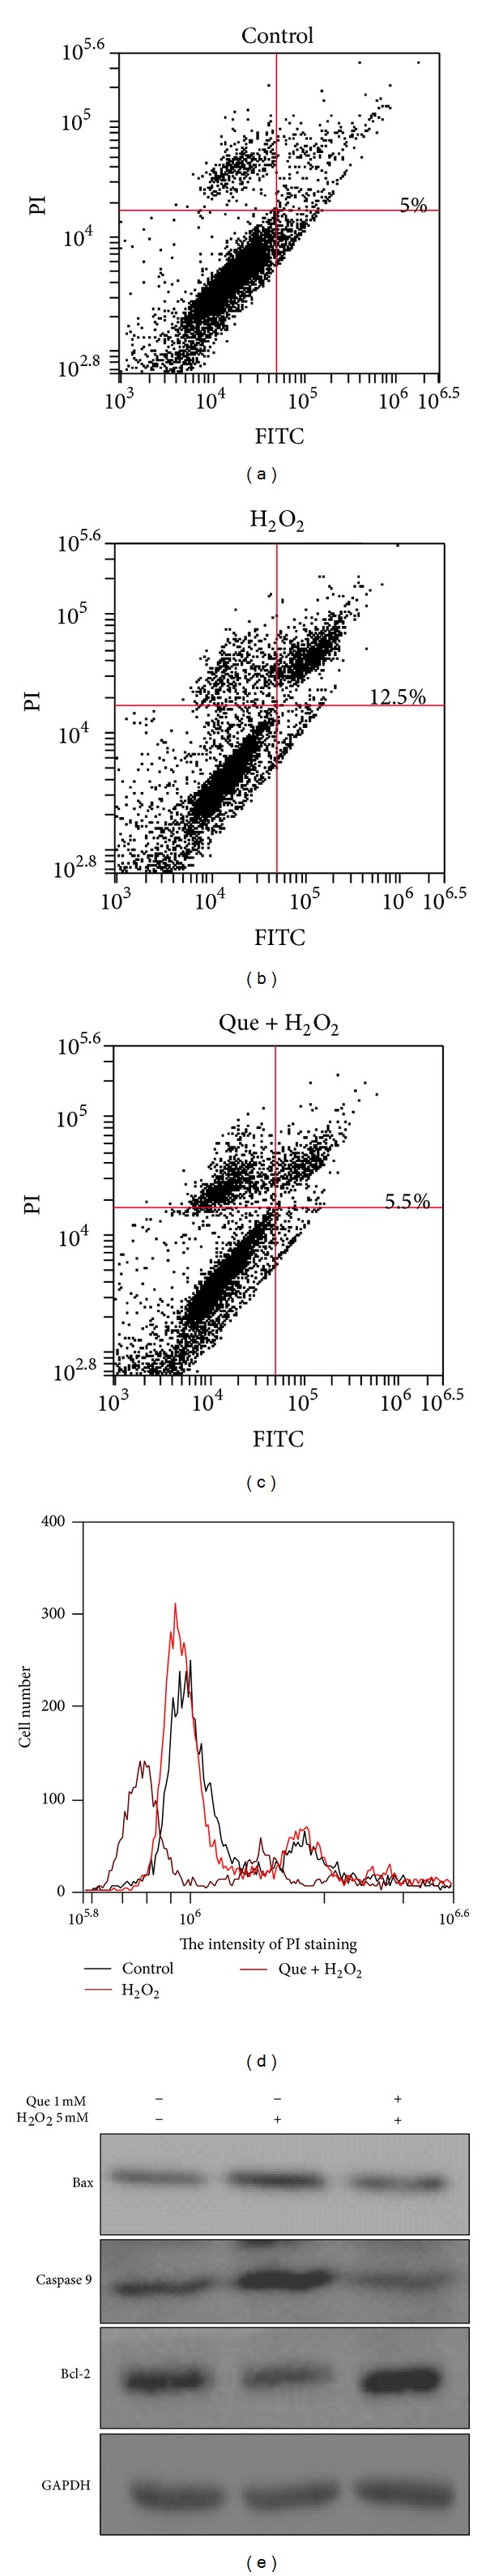
Effects of quercetin on cell apoptosis in H2O2-treated H9C2 cells. ((a), (b), and (c)) Typical dot plots of annexin V-FITC and PI are cells untreated, H2O2 treated, and quercetin pretreated followed by H2O2 treatment. The x-axis and y-axis represent the intensity of annexin V-FITC and PI, respectively. The lower left area of (a), (b), and (c) presented background staining by annexin V-FITC and PI in normal cells and apoptosis signals located in the right area. This figure is representative of 3 replicates. (d) The full lengths of DNA in H9C2 cells were detected by FACS. The x-axis shows the intensity of PI, and the y-axis shows the number of cells. (e) The levels of Bax, BCL-2, and caspase 9 in H9C2 cells were detected by immunoblotting. GAPDH served as a sample loading control.