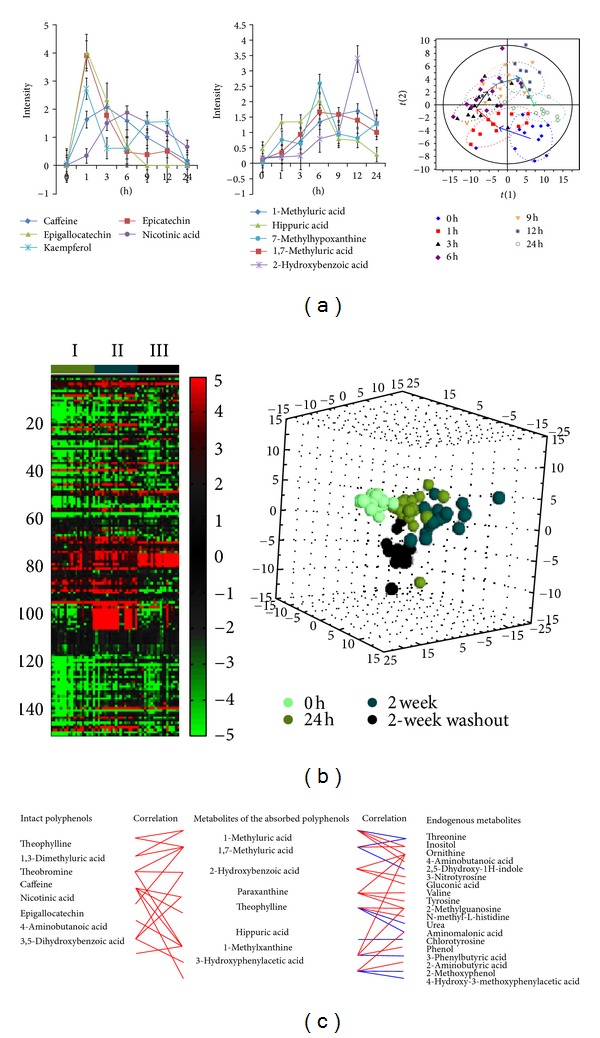
Figure 3.

Dynamic concentration profile of bioavailable Pu-erh tea polyphenols due to in vivo absorption, and hepatic and gut bacterial metabolism, as well as the human metabolic response profile. (a) Urine concentration-time course of some representative substances, intact polyphenols, metabolites of the absorbed polyphenols, and altered endogenous metabolites, after Pu-erh tea intake; (b) effect of Pu-erh tea intake on human urine metabolite endpoints. (left panel) Heatmap showing differences in altered endogenous metabolites detected from the metabolome after Pu-erh tea intake (postdose) as compared to predose metabolome. (I) metabolomic changes at 24 h postdose relative to predose; (II) 2-week postdose versus predose; (III) 2-week washout versus predose. Each cell in the heat map represents the fold change between the two time points (e.g., postdose versus the predose) for a particular metabolite. (right panel) 3D PCA scores plot of urinary metabolic profiles at predose, 24 h postdose, 2 week postdose, and 2 week washout postdose; (c) correlation of intact polyphenols, metabolites of the absorbed polyphenols, and altered endogenous metabolites in response to Pu-erh tea exposure. The relationships among the three groups of compounds were visualized in the form of correlation maps, which are displayed by red (positive) or blue (negative) lines.
