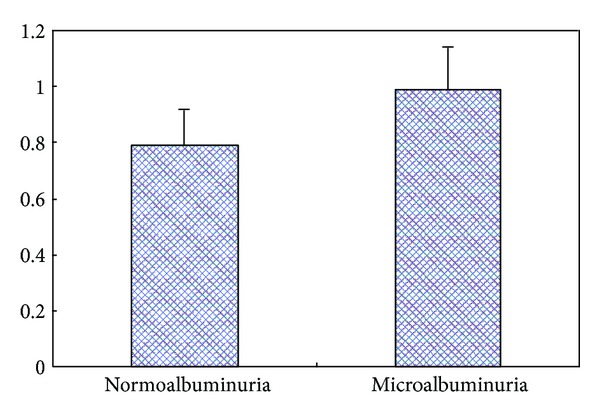
Figure 1.

Comparison of IMT between the two study groups. Continuous variables were expressed as median and range. P < 0.05 from the Wilcoxon rank-sum test for the difference between normoalbuminuria group and microalbuminuria group. IMT: intima-media thickness.
