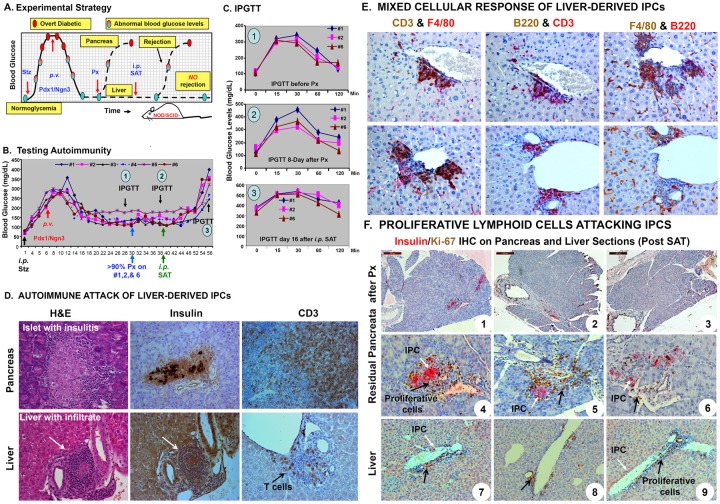
Figure 5.
Autoimmune attack of liver-derived IPCs. A. Experimental strategy. To test whether liver-derived IPCs can escape autoimmune attack, NOD/SCID mice were given diabetes by injecting Stz. The liver-derived IPCs were expected to be reprogrammed by AAV-Pdx1/Ngn3 and these liver-derived IPCs were expected to correct hyperglycemia, confirmed by performing subtotal Px. Once confirmed, diabetogenic SAT was performed to determine if the liver-IPCs resist autoimmune attack by monitoring changes of the blood glucose levels (resistant = normal glucose levels, susceptible = abnormally high glucose levels). B. Testing autoimmunity of the liver-IPCs. Stz-induced diabetic (>250 mg/dL) NOD/SCID mice (n=6) received AAV-Pdx1/Ngn3 viruses (108 vp/mouse). Blood glucose levels were monitored until the end of the experiment. Near normoglycemic mice #1, #2, and #6 underwent subtotal Px and remained normoglycemic. Diabetogenic NOD splenocytes (2X10⁷ cells/mouse), were transferred i.p. to all Pdx1/Ngn3-treated mice including the three mice receiving Px at day 10 post-surgery. C. IPGTT. Mice were injected with glucose (2 mg/g body weight i.p.) and blood glucose levels were measured at indicated time points. Three IPGTTs were performed at various times (1. Before Px; 2. Day-8 post Px; and 3. Day 16 SAT). All mice were sacrificed after the last IPGTT. D. Autoimmune attack of the liver-IPCs. The livers and pancreata from the above mice were harvested for morphologic evaluation. Liver and pancreas sections were H&E stained (left panel) or immunostained with anti-insulin (middle panel) or anti-CD3 (right panel) antibodies. Arrows indicate infiltrating lymphocytes. E. Mixed cellular response of liver-derived IPCs. Mice were sacrificed 2-3 weeks post-SAT. Double IHC for identification of T-cells (CD3+), B-cells (B220+), and macrophages (F4/80+) was performed on AAV-Pdx1/Ngn3-treated mouse liver and pancreas sections following SAT. The liver sections were sequentially immunostained for CD3, B220, and anti-F4/80 for 1 hr, followed by appropriate secondary antibodies. Staining of T-cells, B-cells, and macrophages in the inflammatory infiltrate was visualized either in brown (DAB) or red (LPR) as indicated. F. Proliferative lymphoid cells attacking IPCs. Insulin (red) and Ki-67(brown) double IHC was performed on the pancreas and liver sections in the AAV-Pdx1/Ngn3-treated mice 2-3 weeks following SAT. Photographs 1-3 represent the total residual pancreas following subtotal Px. Black arrows indicate proliferating lymphocytes surrounding residual pancreatic insulin-producing beta cells (White arrows, panels 4-6) and liver-IPCs (white arrows, panels 7-9).

