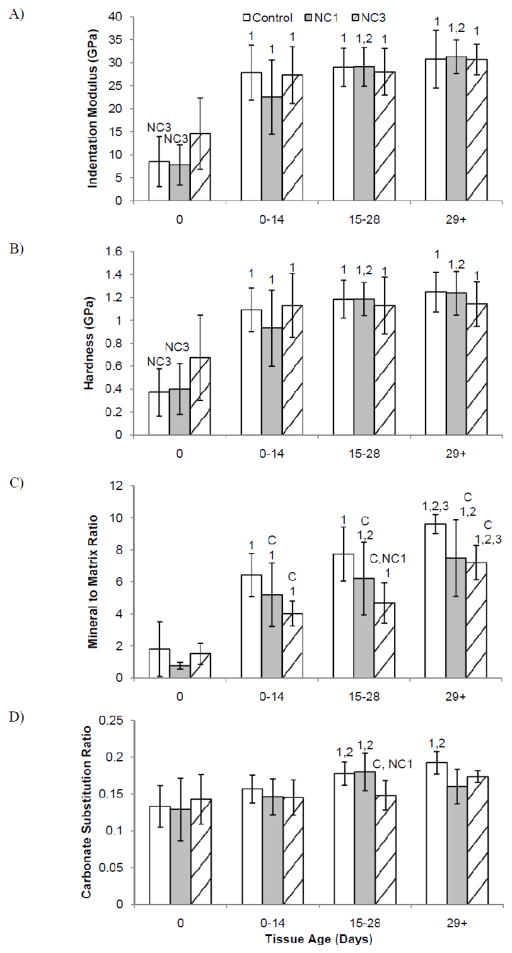
Figure 2.
Mean A) indentation modulus, B) hardness, C) mineral:matrix ratio and D) carbonate substitution by diet group versus tissue age zone. Significantly different from Control (C), NC1 (NC1), NC3 (NC3) within a single tissue age zone. Significantly different from 0 day old tissue (1), 0–14 day old tissue (2), and 15–28 day old tissue (3) within the same group. Error bars indicate standard deviation.

