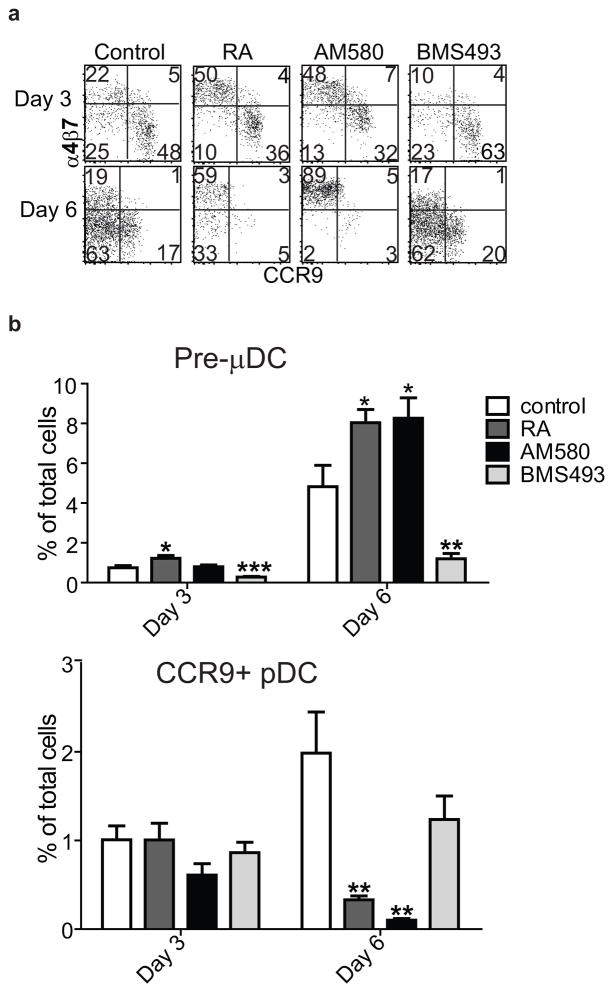
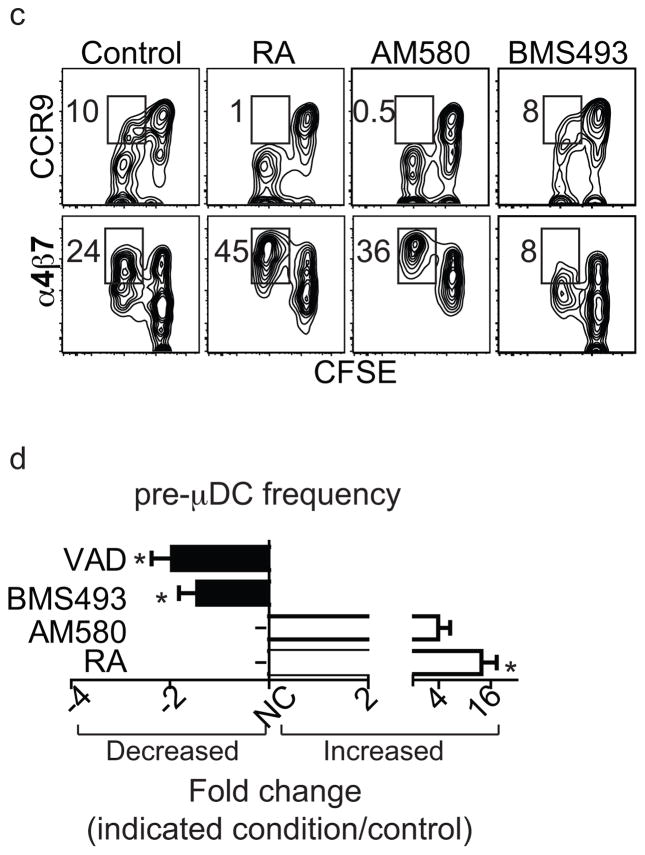
Figure 5. Retinoic acid regulates pre-μDC development in the BM.
a–b) Total BM cells were cultured in complete media supplemented with 100 ng/ml of Flt3L in the absence (control) or presence of 1 nM RA, 10 nM AM580 (an RARα agonist), or 100 nM BMS498 (a pan RAR inverse agonist). Cells were harvested on days 3 and 6 and stained for pre-μDC and CCR9+ pDC markers. a) Cells were gated on Lin−CD11c+B220+ (Lin indicates CD3, CD19, DX-5, Ter-119, Ly6G). Numbers in each quadrant indicate percent cells. b) Percent of pre-μDCs (top) and CCR9+ pDCs (bottom) on days 3 and 6 in total BM cultures, grown under the conditions described in panel a legend. Data show combined results from four independent experiments with n=6–8 for each condition. Error bars show SEM. * p<0.05, **p<0.01, ***p<0.001 compared to control by Student’s t-test. c) Total BM cells were labeled with CFSE and cultured as described in the panel a legend. Cultures were harvested on day 3 and cells were gated on Lin−CD11c+B220+. Numbers indicate percentage cells. d) Fold change of pre-μDC frequency in BM from mice treated with each indicated condition compared to control. VAD: vitamin A deficient mice, n=10, control: n=8; BMS493/AM580/RA: mice received BMS493 or vehicle (for 7–18 days, n=4 each), AM580 or vehicle (4–6 days, n=2) or RA or vehicle (4–6 days, n=3). Pre-μDC frequency (among total BM cells) was determined. The fold change in frequency in treated vs. control mice in each paired comparison was calculated, and is shown with SEM or (for AM580) range. * p<0.05 by Mann Whitney test between treated and control mice.


