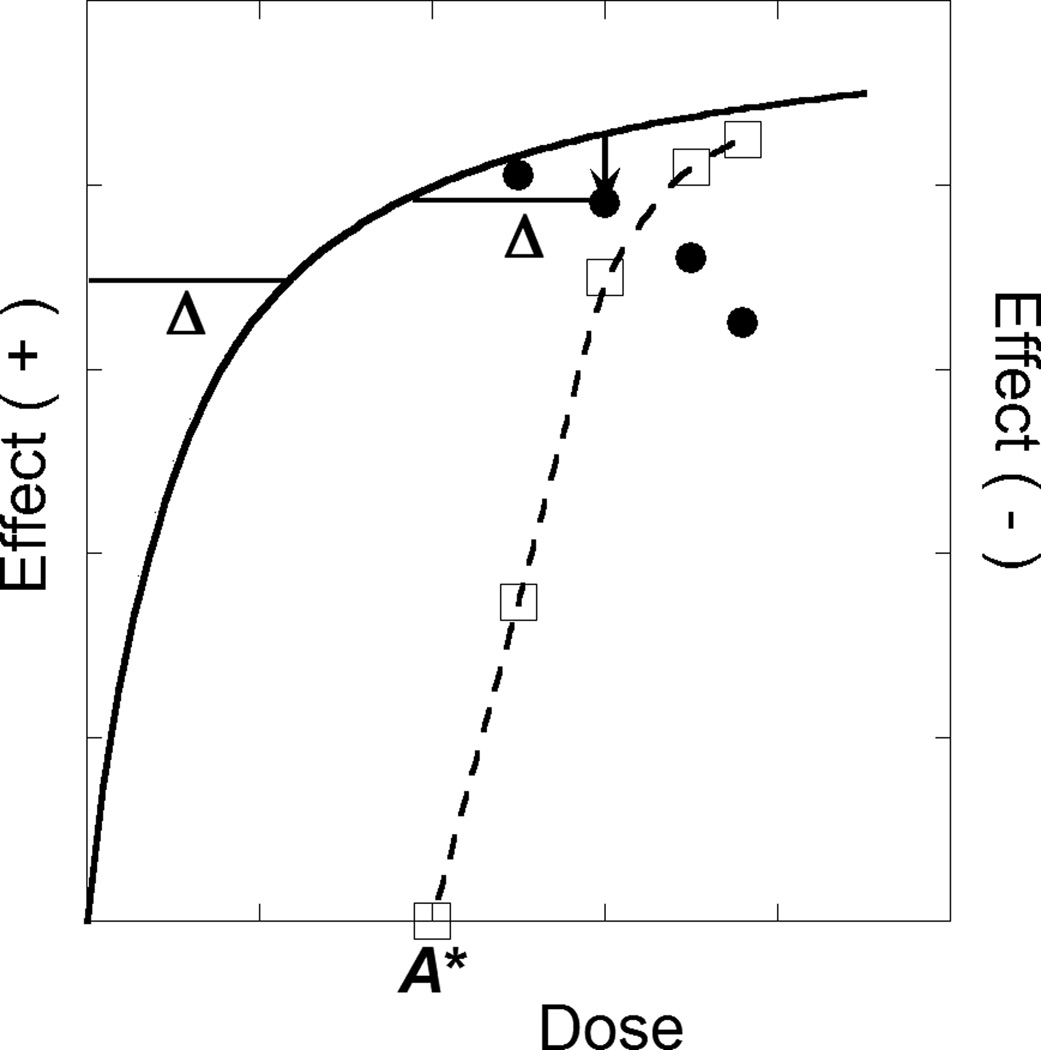
Figure 1.
This figure illustrates the analysis of an inverted-U dose-effect curve. The dose-effect curve (solid) is shown to be monotone increasing for doses up to A*, whereas for greater doses the effect decreases due to a second component of action. The broken curve, whose effect magnitudes are indicated on the right ordinate scale, show the decreasing effects for doses greater than A*. The combination of the decreasing and increasing components of action produce the inverted U shape. A representative drop (a ordinate its vertical location gives the effect value (open square). All drops are analyzed in the same way and produce the set of open squares through which we constructed the broken curve shown.

