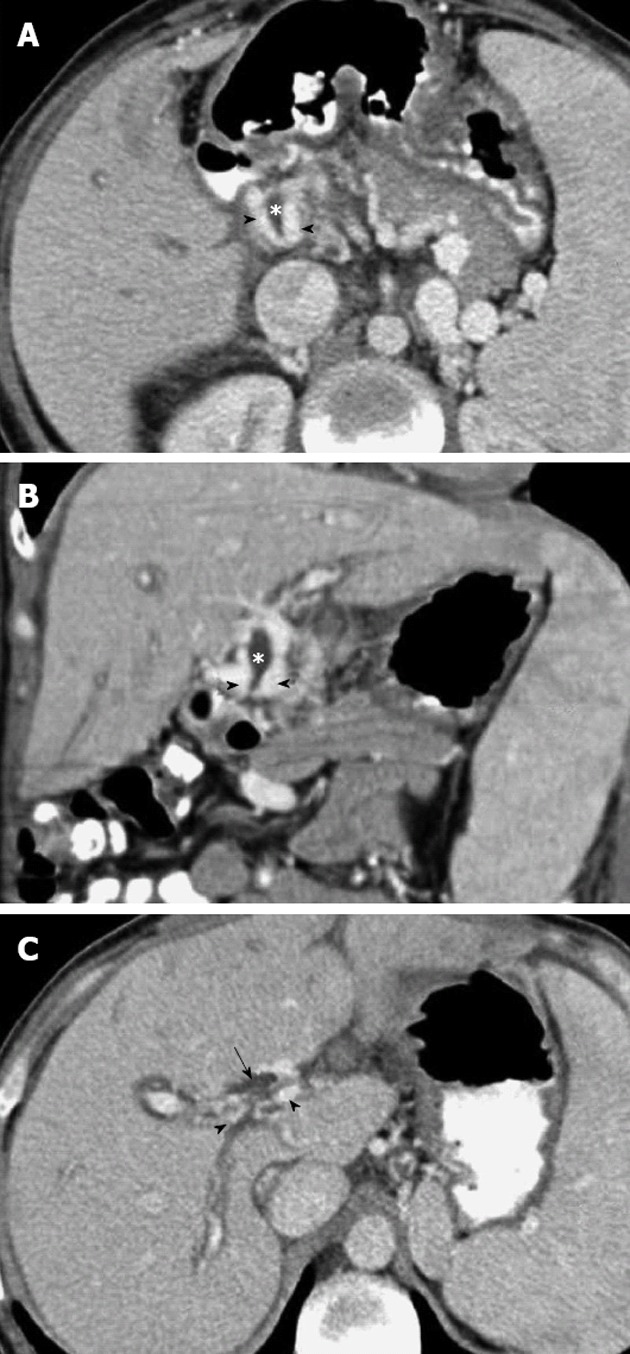
Figure 4.

Portal phase abdominal computed tomography. A, B: Axial (A) and coronal planes (B) show multiple dilated collateral representing the paracholedochal plexus (arrowheads) with reduced diameter of the bile duct (*), secondary to extrinsic compression by the cavernoma; C: The superior axial image shows dilatation of the bile ducts (arrow).
