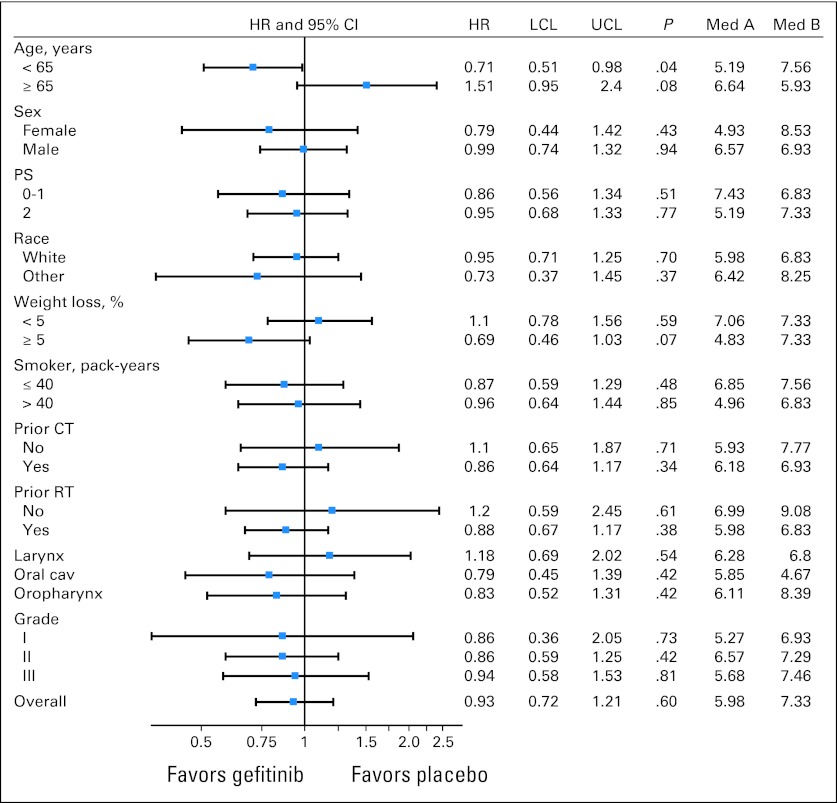
Fig 3.
Forest plot representing hazard ratios (HRs) with 95% CIs of overall survival in patient subgroups. Cav, cavity; CT, chemotherapy; LCL, lower confidence limit; Med A, median overall survival in arm A; Med B, median overall survival in arm B; PS, performance status; RT, radiotherapy; UCL, upper confidence limit.

