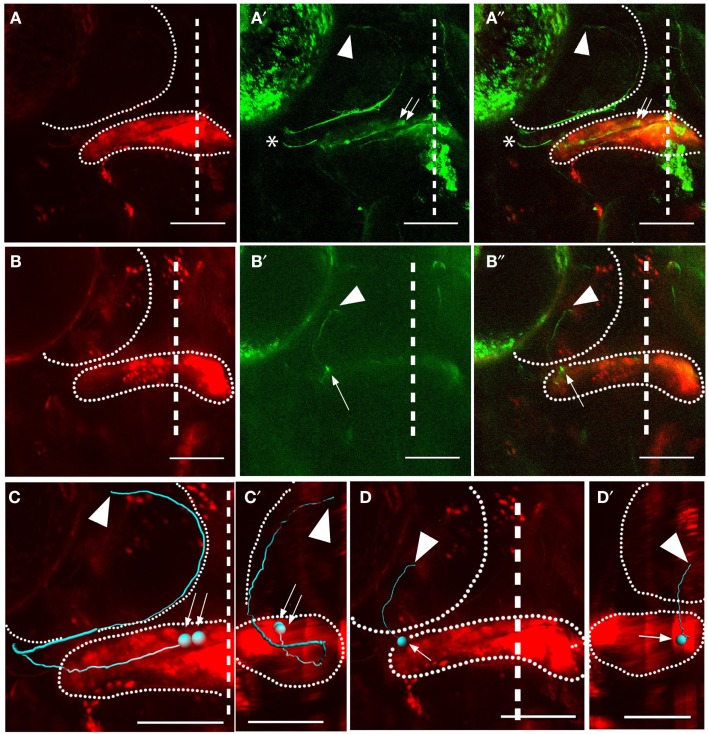
Figure 4.
Subtypes of eurydendroid cells. Red shows Kaede and green shows GFP (expressed from the BGUG transgene). (A) A dorsal z-projection of a pair of cells from the medial cerebellum targeting the thalamus. (A) Shows the red channel (photoconverted Kaede), and (A′) shows the green channel (GFP), with an arrow indicating the cell bodies and arrowhead indicating the corresponding termination points. (A″) Shows a merged image of (A,A′). Imaging of this projection is weak when the neurites are in deep ventral positions, and overlying neurites from other neurons [asterisks in (A′,A″)] can obscure these z-projections, so these cells are best viewed as z-series (Movies S3 and S4 in Supplementary Material). (B) A dorsal z-projection of a cell from the intermediate cerebellum targeting the tectum. The positions of the cell body (arrow) and axon terminal (arrowhead) are indicated. (C,D) show dorsal Imaris tracings of cells shown in (A′,A″) and (B′,B″), respectively, with cell bodies indicated by arrows and terminations indicated with arrowheads. Both the cerebellum and tectum are indicated with dotted lines. (C′–D′) show sagittal views of tracings in (A′,A″) and (B′,B″), dorsal to the left, with the cerebellum and tectum indicated with dotted lines. The cell in (A′,A″) can be seen to extend to deep ventral positions before extending to the tectum and thalamus, while cell in (B′,B″) has a relatively flat sagittal profile. Scale bars represent 100 μm. For z-series of the cells shown in (A,B), see Movies S3 and S4 in Supplementary Material, where the paths of the axons are clearer than in the two-dimensional shown here.

