
Figure 2.
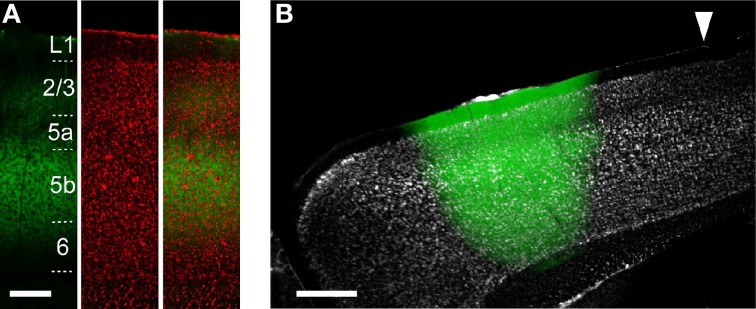
ChR2 expression in ChR2 Tg and AAV-ChR2 mice. (A) Anti-GFP immunofluorescence (left), Nissl staining (middle), and the overlay (right) in the CFA in a sagittal section from a ChR2 Tg mouse. Scale bar, 200 μm. (B) Overlay of EYFP fluorescence (green) and Nissl staining (gray) in a sagittal section of a mouse in which AAV-ChR2-EYFP was injected into the RFA. Arrowhead indicates 0 mm anterior and 0.8 mm lateral from the bregma. Scale bar, 500 μm.