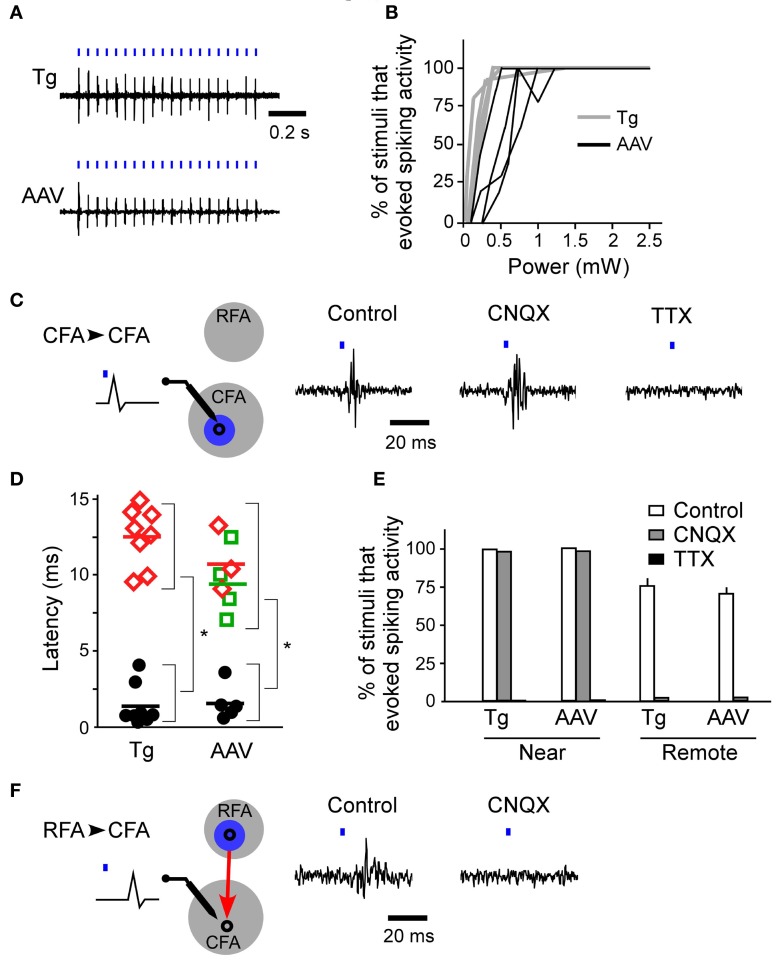
Figure 3.
Firing activities evoked by ChR2 photostimulation of the RFA and CFA. (A) Representative spiking activities induced by photostimulation of the CFA in the ChR2 Tg and AAV-ChR2 mice. Both traces were recorded in L5 of the CFA. The horizontal distances between the photostimulation points and the recording sites were approximately 200 μm. The blue bars represent the photostimuli (10 ms durations at a frequency of 20 Hz). The laser intensity was 2.5 mW. (B) Relationship between the laser power and the percentage of trials in which firing activities were evoked near the photostimulation points (gray, six sites in four ChR2 Tg mice; black, four sites in three AAV-ChR2 mice). The duration of photostimulation was 10 ms. (C) Left, A schematic of the experimental arrangement for photostimulation (blue) of the CFA (gray) with simultaneous electrical recording in the CFA. CFA photostimulation directly evoked firing of neurons in the CFA. Right, Representative data showing spike activities recorded in the CFA when the CFA was photostimulated in control conditions, upon CNQX application, and upon TTX application. The data were obtained from the same recording site and the same photostimulation site in a ChR2 Tg mouse. The duration of photostimulation was 2 ms. (D) Latencies of evoked spiking activities. Black circles indicate the electrical recordings that were made near the photostimulation points (horizontal distance of approximately 200 μm) in the RFA and the CFA. Red diamonds indicate the electrical recordings in the CFA that were responses to RFA photostimulation. Green squares indicate the electrical recordings in the RFA that were responses to CFA photostimulation. Each colored bar indicates the mean latency for the condition presented in the corresponding color. *P < 10−4 by Student's t-tests. (E) The percentage of trials that evoked spiking activities in control, CNQX application, and TTX application conditions in ChR2 Tg mice (near: control, n = 6; CNQX, n = 2; and TTX, n = 2; remote: control, n = 4; and CNQX, n = 2) and AAV-ChR2 mice (near: control, n = 4; and CNQX, n = 2; and TTX, n = 2; remote: control, n = 4; and CNQX, n = 2). Error bars indicate SEM. (F) Left, A schematic of the experimental arrangement for photostimulation (blue) of the RFA (gray) with simultaneous electrical recording in the CFA. RFA photostimulation evoked postsynaptic firing activities in the CFA via the synaptic projection (red). Right, Representative data showing evoked activities in the CFA when the RFA was photostimulated. Control conditions and application of CNQX to the CFA are shown. The data were obtained from the same recording site and the same photostimulation site in a ChR2 Tg mouse. The duration of photostimulation was 2 ms.

