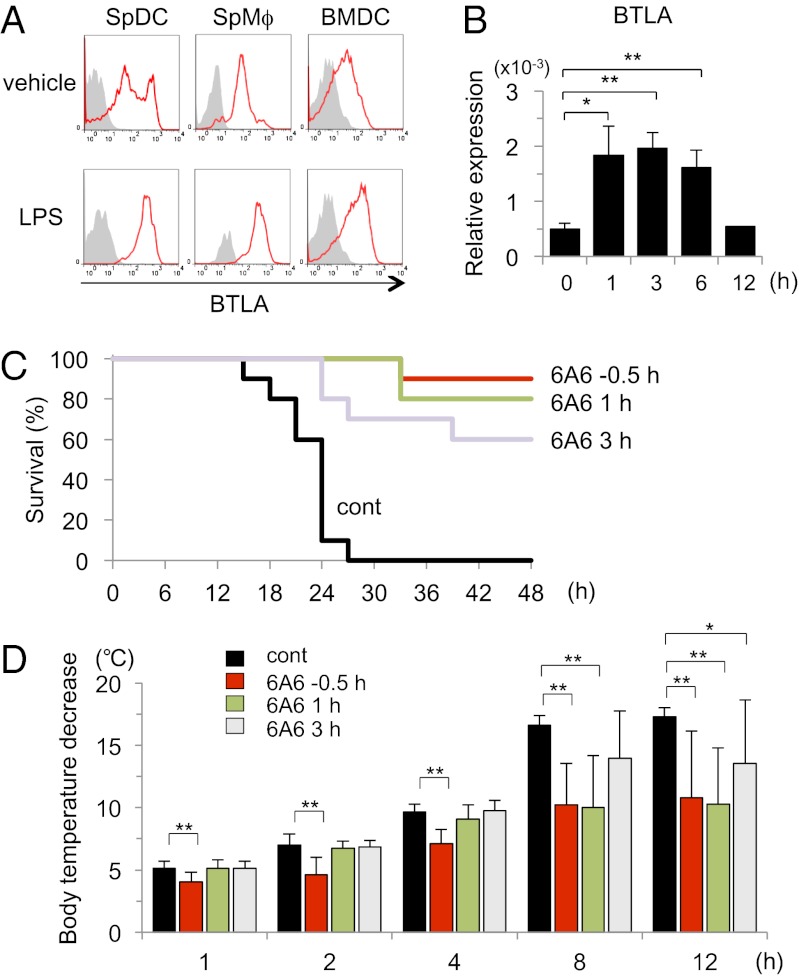
Fig. 6.
An agonistic anti-BTLA antibody rescues mice from LPS-induced endotoxic shock. (A) Splenocytes were stimulated with LPS (100 ng/mL) for 12 h, and the expression levels of BTLA on DCs (CD11c+ MHC II+ cells) and Mϕs (F4/80+ CD11b+ cells) were analyzed by flow cytometry. BMDCs were stimulated with LPS (100 ng/mL) for 12 h, and the expression levels of BTLA were analyzed by flow cytometry. Shown are representative histograms of BTLA staining with control staining (gray histograms) of three independent experiments. (B) BMDCs were stimulated with LPS (100 ng/mL) for the indicated time period, and mRNA levels of BTLA were measured by quantitative PCR. Data are mean ± SD, n = 4. *P < 0.05, **P < 0.01. (C and D) C57BL/6 mice were injected i.p. with LPS (750 μg/body). Where indicated, 6A6 (400 μg/mouse) was administered to the mice at −0.5, +1, and +3 h from the timing of LPS administration. (C) Survival of the mice was analyzed by Kaplan–Meier survival analysis. n = 10 mice for each group; control vs. −0.5 h (P < 0.0001), control vs. 1 h (P < 0.0001), and control vs. 3 h (P < 0.0005; log rank test). (D) Body temperature was evaluated at 0, 1, 2, 4, 8, and 12 h after LPS injection. Body temperature decreases from the baseline are shown. Data are mean ± SD, n = 10 for each group. *P < 0.05, **P < 0.01.

