Fig. 1.
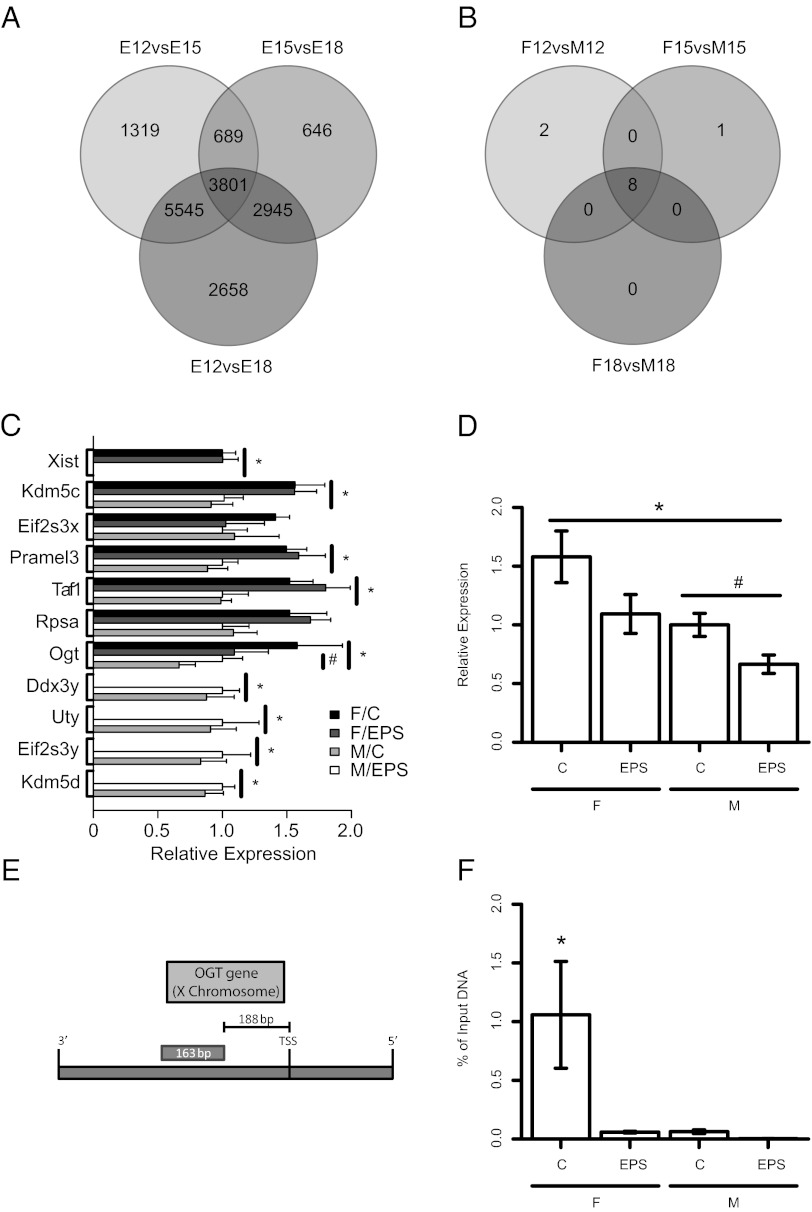
Identification of OGT as a potential biomarker of maternal stress. (A) Venn diagram of developmental differential expression analyses of mouse placental genes via Affymetrix GeneChip Mouse Gene 1.0 ST microarray. The labels of each circle refer to specific embryonic time point comparisons represented: E12vsE15 are the comparisons between E12.5 (n = 6) and E15.5 (n = 6), E15vsE18 are the comparisons between E15.5 and E18.5 (n = 6), and E12vsE18 are the comparisons between E12.5 and E18.5. The numbers within the diagram represent the number of genes characterized as having differential expression between these groups, independent of sex, using a false discovery rate of 0.05. (B) Venn diagram of sex differences in mRNA expression levels analyses of mouse placental genes via microarray. Circle labels refer to the sex comparisons made during each developmental time point. The numbers are derived as in A. (C) Genes identified as having sex differences in expression examined in our EPS model. C, control; F, female; M, male (n = 7); EPS, early prenatal stress (n = 8). Data for Xist were normalized to the female control levels; data for all other traits were normalized to male control levels. Bars are the maximum likelihood estimate for each group ± the 95% confidence interval for that estimate. Symbols (* for sex and # for EPS) indicate a main effect with a confidence interval that does not bound zero as determined by the linear model (y ∼ Sex + EPS + Sex*EPS). (D) OGT was identified as fitting our biomarker criteria for having both sex differences in expression and responding to EPS. Symbols (* for sex and # for EPS) indicate a main effect with a confidence interval that does not bound zero as determined by the linear model (y ∼ Sex + EPS + Sex*EPS). Normalization is as in C. (E) Diagram of the promoter region of OGT used for ChIP analysis for presence at H3K4me3. (F) ChIP analysis of the OGT promoter demonstrating the expression changes in OGT are associated with the presence or absence of the transcriptional activator mark, H3K4me3. Data are representative of the amount of DNA (normalized to the amount of input or nonimmunoprecipitated DNA) from the promoter region of OGT associated with the H3K4me3 chromatin mark. Bars are the maximum likelihood estimate for each group ± the 95% confidence interval for that estimate. Asterisk indicates a measurable difference between female control and all other groups as determined by nonoverlapping confidence intervals for these estimates.

