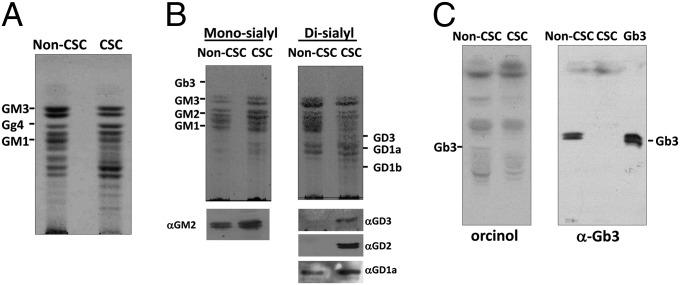
Fig. 2.
HPTLC profiles of GSLs extracted from non-CSCs and CSCs. (A) Upper-phase GSLs from 5 × 10⁶ non-CSCs and CSCs were separated on an HPTLC plate and visualized by orcinol spraying. (B) Monosialoganglioside (Mono-sialyl) GSL or disialoganglioside (Di-sialyl) GSL fractions were separated from total polar upper-phase GSLs with DEAE-Sephadex columns. GSLs were visualized by orcinol spraying and characterized by immunostaining with mAbs specific to GM2, GD3, GD2, or GD1a. (C) Lower-phase GSLs from 5 × 10⁶ non-CSCs and CSCs were processed for the detection by orcinol spraying or immunostaining with anti-Gb3Cer mAb.

