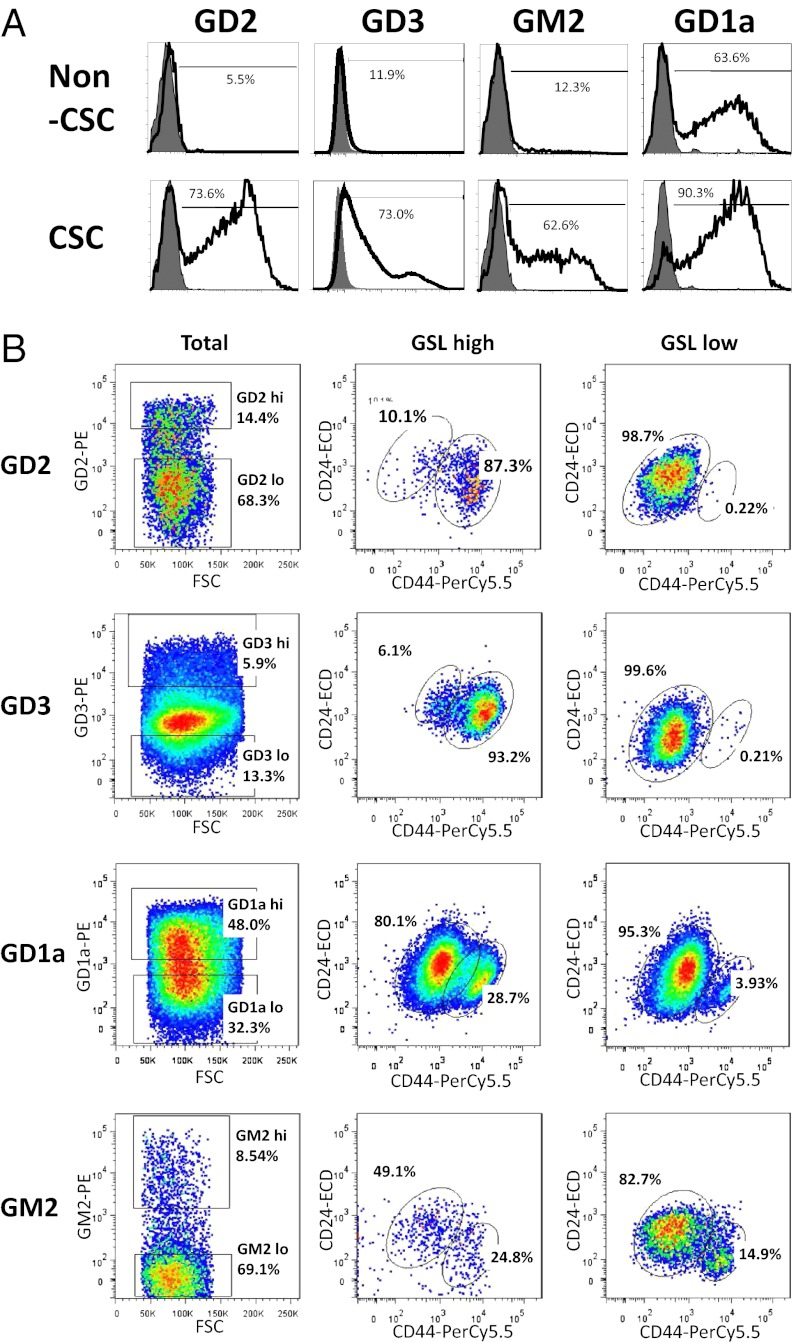
Fig. 4.
Correlation of the expression levels of the GSLs with the CD44hi/CD24lo phenotype. (A) The expressions of GSLs in CSCs and non-CSCs were analyzed by flow cytometry. Up-regulation of GD2, GD3, GM2, and GD1a in CSCs were detected with flow cytometry. Cells were stained with antibodies against indicated GSLs and are shown with solid line. Stained isotype controls are shown in gray. Values presented the mean of three experiments. (B) HMLE-Twist-ER cells were triple-stained with anti–CD44-PC5, anti–CD24-ECD, and GSL-specific antibodies conjugated with phycoerythrin then analyzed by flow cytometry. Plots are gated for GSL-high or GSL-low populations in plots labeled “Total.” Plots are gated for CD44hi and CD24lo in plots labeled “GSL high” and “GSL low.”

