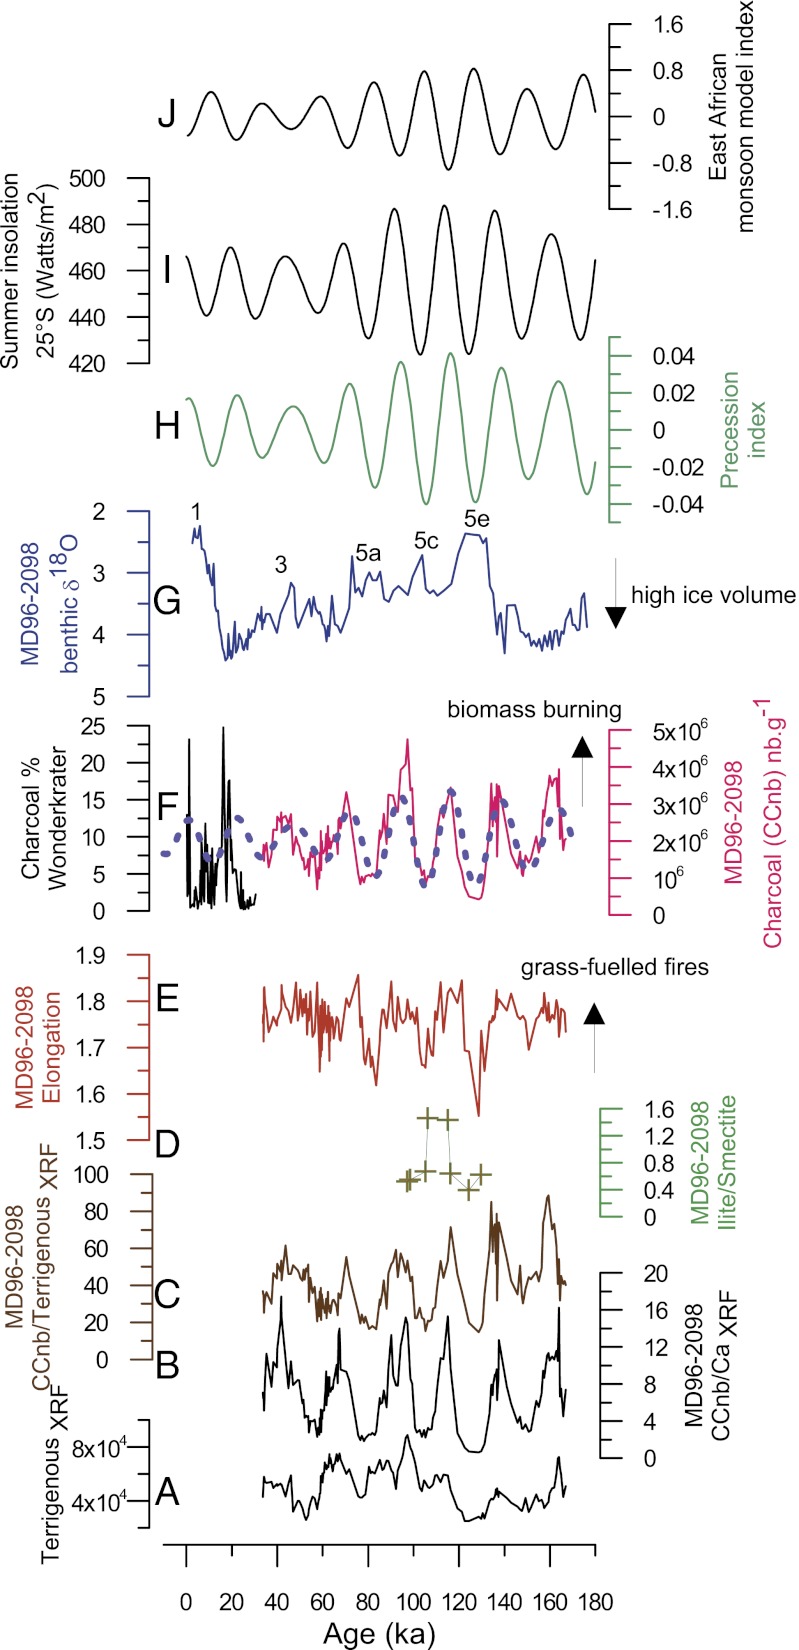
Fig. 2.
Biomass burning variability of southern Africa over the last 170 ka. (A) Terrigenous fraction (Al+K+Ti+Fe) obtained from XRF core scanner from core MD96-2098. (B) Standardized microcharcoal concentration (CCnb curve) to CaXRF from core MD96-2098. (C) Standardized microcharcoal concentration (CCnb) to TerrigenousXRF from core MD96-2098. (D) Illite/smectite ratio from MD96-2098 clay analysis. (E) Elongation (ratio length/width) of microcharcoal particles. (F) Microcharcoal concentration curve (red) (CCnb, biomass burning); predicted biomass burning obtained from a simple linear regression model (dashed purple curve); charcoal percentage, ratios of charcoal number to all other organic particles curve from Wonderkrater peat bog (black curve) (28), age model from ref. 49 and the Abrupt Climate Changes and Environmental Responses (ACER) International Focus Group (International Union for Quaternary Science). (G) Benthic foraminifera oxygen isotopic curve from MD96-2098 (36). (H) Precession index calculated with analyseries software (47) following ref. 46. (I) Summer insolation (DJFM months) calculated at 25°S following ref. 46. (J) East African monsoon model index after ref. 32. Warm substages of Marine Isotopic Stage 5 are also indicated.

