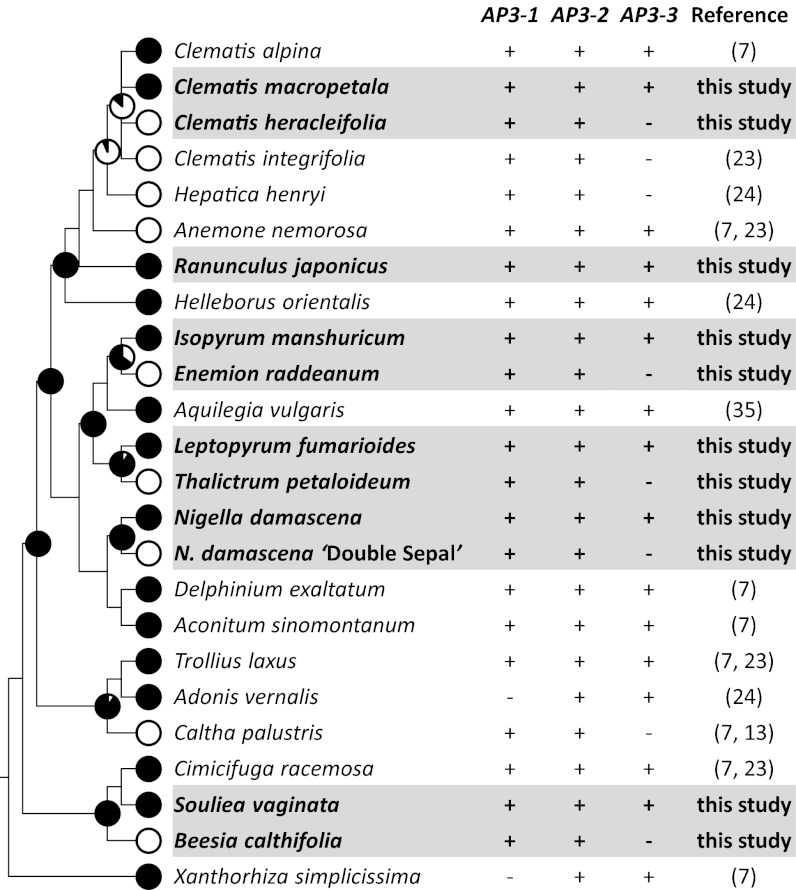
Fig. 1.
Correlation between loss of petals and expression of AP3-3 across the Ranunculaceae. Filled and open circles on the phylogenetic tree indicate the presence and absence of petals, respectively. The probability of having petals in ancestral taxa is indicated for each interior node (Fig. S1 gives details). The symbols + and − denote whether the AP3 paralogs can or cannot be isolated using the conventional RT-PCR technique, respectively.

