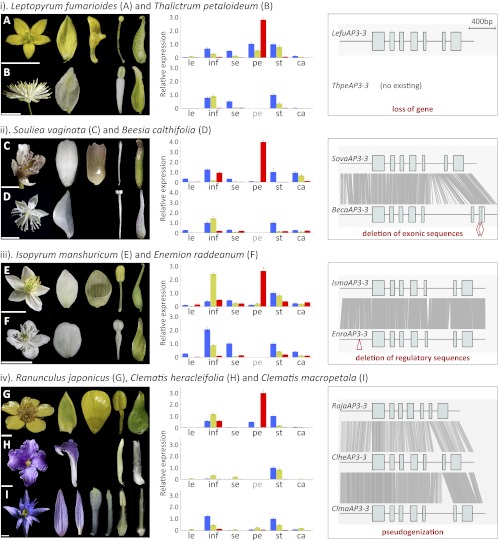
Fig. 3.
Relative expression and exon–intron structures of the AP3-3 orthologs from petalous and apetalous Ranunculaceous species. (Left) Flower and floral organs of the sampled species. (Scale bars, 0.5 cm.) (Center) Expression of AP3-1 (blue bars), AP3-2 (yellow bars), and AP3-3 (red bars) as revealed by qRT-PCR. Tissues assayed are leaf (le), inflorescence (inf), sepal (se), petal (pe), stamen (st), and carpel (ca). (Right) Exon–intron structures of the AP3-3 orthologs. Alignable regions between orthologs are shown with gray lines. Two red diamonds in BecaAP3-3 and one red triangle in EnraAP3-3 represent the deletions in the coding and regulatory regions, respectively.

