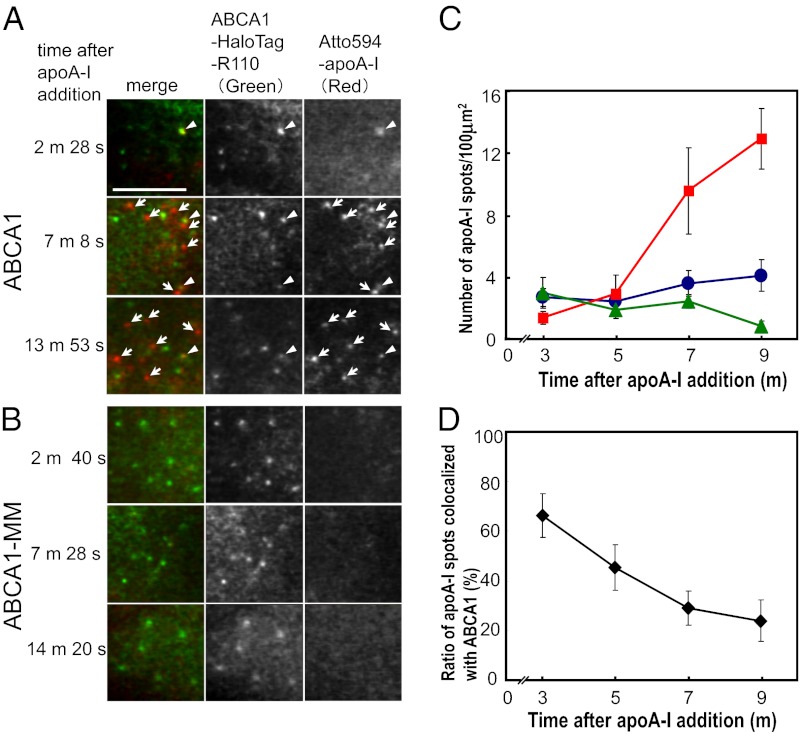
Fig. 4.
Colocalization of ABCA1 and lipid-free apoA-I on the PM. (A and B) Simultaneous two-color single-molecule fluorescence imaging of ABCA1 (A) or ABCA1-MM (B) with apoA-I. ABCA1 was fused with Halo protein to its carboxyl terminus and labeled with rhodamine 110 (ABCA1-HaloTag-R110). ApoA-I was labeled with Atto594 (Atto594–apoA-I). Arrowheads indicate colocalization of ABCA1 and apoA-I. Arrows indicate apoA-I only (i.e., not colocalized with ABCA1). (Scale bar, 5 μm.) (C) Time-dependent changes in the number of apoA-I spots not colocalized with ABCA1 (red squares) and of apoA-I spots colocalized with ABCA1 (blue circles) on the PM of ABCA1-expressing cells per unit area (100 μm2). The total number of apoA-I spots on the PM of ABCA1-MM–expressing cells per unit area (100 μm2) is also shown (green triangles). ApoA-I spots (mean ± SE) at designated intervals (e.g., 2–4 min, plotted at 3 min; 4–6 min, plotted at 5 min) after apoA-I addition were observed (ABCA1, 6–8 cells; ABCA1-MM, 2–6 cells). (D) Time-dependent changes in the percentage of apoA-I spots colocalized with ABCA1 on the upper PM surface (mean ± SE) (see C for x-axis details).

