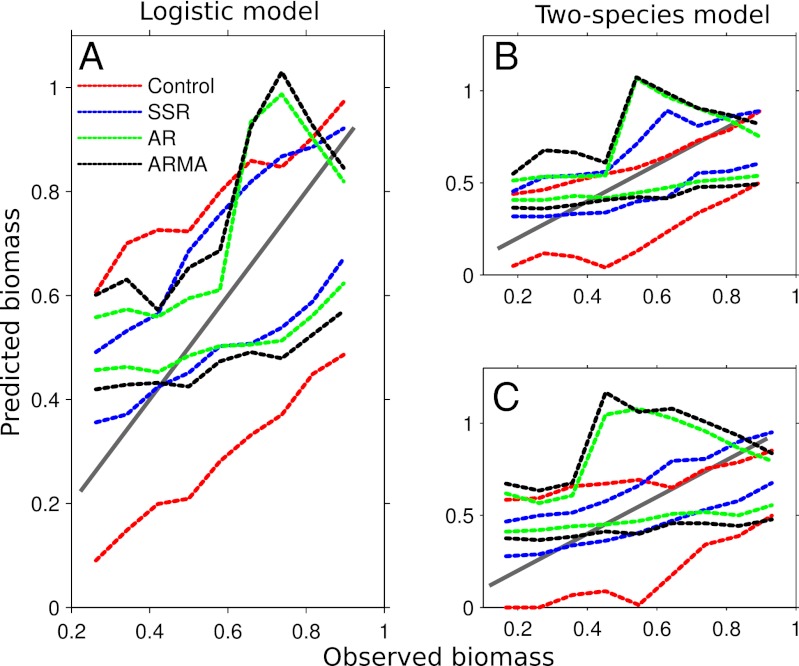
Fig. 2.
Predicted vs. observed for the logistic (A) and two-species models (species x and y are B and C, respectively). One-to-one line in gray (representing perfect predictions) and dotted lines showing 90% confidence intervals for each forecast method over all observations. The SSR model provides the tightest confidence intervals about the one-to-one line.

