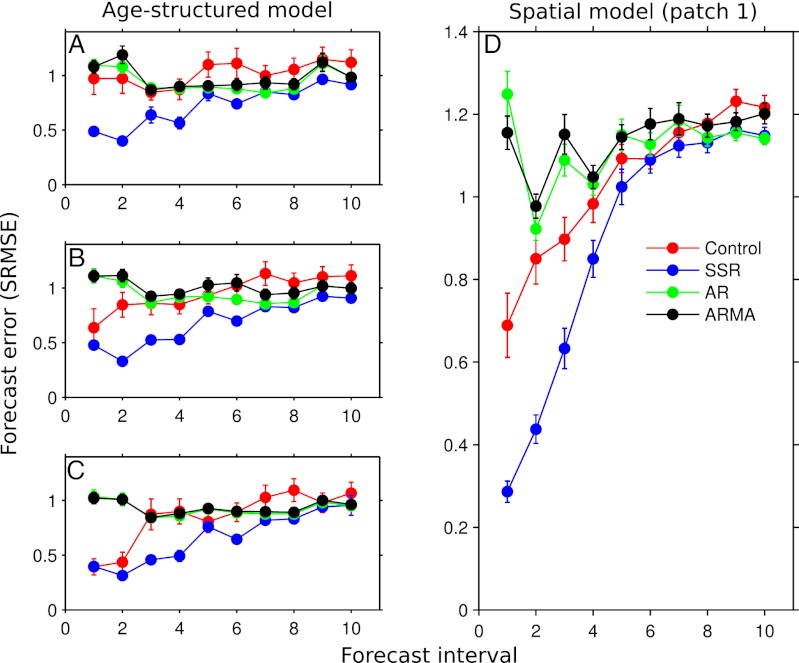
Fig. 3.
Error of each forecasting method for the age-structured model (A–C) and patch 1 of the spatial model (D); similar results were obtained for patches 2–4 of the spatial model. For the age-structured model, ages 0, 1, and 2 are represented by A, B, and C, respectively. The red, blue, green, and black lines show the forecast error for the fitted control model, SSR model, AR model, and ARMA model, respectively.

