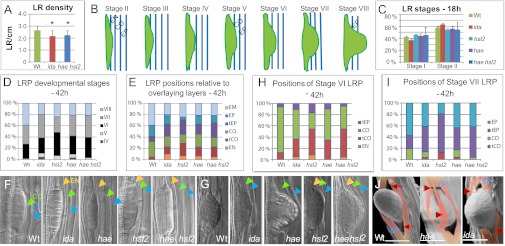
Fig. 1.

Mutations in IDA, HAE, and HSL2 delay LR emergence. (A) LR density (number of LRs per cm root) for ida (n = 21), hae hsl2 (n = 22), and WT plants (n = 20) 12 d after stratification. *Significant deviation from WT based on Student t test. (B) Schematic presentation of the stages of LR development. (C) Percentage of LRP at stages I and II for ida (n = 68), hae (n = 68), hsl2 (n = 81), hae hsl2 (n = 81), and WT plants (n = 69), 18 h after LR induction. (D) Percentage of LRP at stages IV to VIII (emerged) for ida (n = 68), hae (n = 59), hsl2 (n = 58), hae hsl2 (n = 56), and WT plants (n = 62), 42 h after LR induction. (E) Percentage of LRP with tips positioned in the overlaying EN, CO, and EP tissues or touching the CO or EP layer (tCO and tEP, respectively) for WT and mutants, as indicated. EM, emerged LRs. Numbers as in D. (F and G) WT and mutant LRP, as indicated, at stage V (F) and stage VI to VII (G). Overlaying EN, CO, and EP cells are indicated in orange, green, and blue arrowheads, respectively. (H) Percentage of stage VI LRP with tips positioned in the overlaying EN, CO, and EP tissues or touching the CO or EP layer (tCO and tEP, respectively) for WT and mutants, as indicated. (I) Percentage of stage VII LRP with tips positioned in the overlaying CO and EP tissues or touching the CO or EP layer (tCO and tEP, respectively) for WT and mutants, as indicated. (J) Cryo SEM images of emerged WT, hae, and ida LRs. The EP cells on each side of the LR have been colored. Arrows, symmetrical openings between EP cells in WT. Arrowheads, rifts in flattened and ruptured EP cells of mutant. (Scale bar: 50 μM.)
