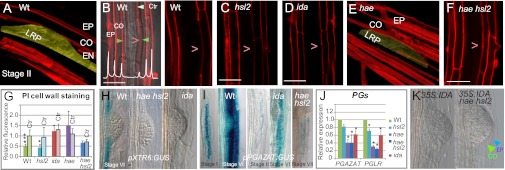
Fig. 3.

IDA, HAE, and HSL2 influence cell wall remodeling and degradation. (A) 3D Z-stack confocal image of PI-stained WT root at the site of a stage I WT LR. The LRP has been colored yellow. (B) 2D confocal image showing scan (white graph) of the fluorescence from PI-stained EN, CO, and EP cell walls at the site of WT LRP (green arrowheads). Control scans were taken below and above the LRP (light green arrowhead). >, position of LRP. (C–F) Confocal images of PI-stained roots at the site of a stage I LRs for hsl2 (2D), ida (2D), and hae (3D, yellow colored LRP) and hae hsl2 (2D). (G) PI fluorescence of LRP-overlaying cell walls between EN and CO relative to the reference point at the opposite side based on scans for six to nine roots. Bars indicate SD. Asterisks denote significant differences from fluorescence at control positions relative to the same reference point (Ctr) (*P < 0.05; ***P < 0.001, Student t test). (H and I) Expression of pXTR6:GUS and pPGAZAT:GUS and in WT, ida, and hae hsl2 background at the LR stages indicated. (J) Expression levels of PGAZAT and PGLR in mutant 7-d-old roots relative to WT determined by RT-qPCR. Bars indicate SD. *Significant deviation from WT (P < 0.05). (K) Stage VII LRP of 35S:IDA and 35S:IDA hae hsl2, as indicated. Arrowheads, cell walls of overlaying CO and EP cells. (Scale bars: 30 μM in 3D images, 20 μM in 2D images.)
