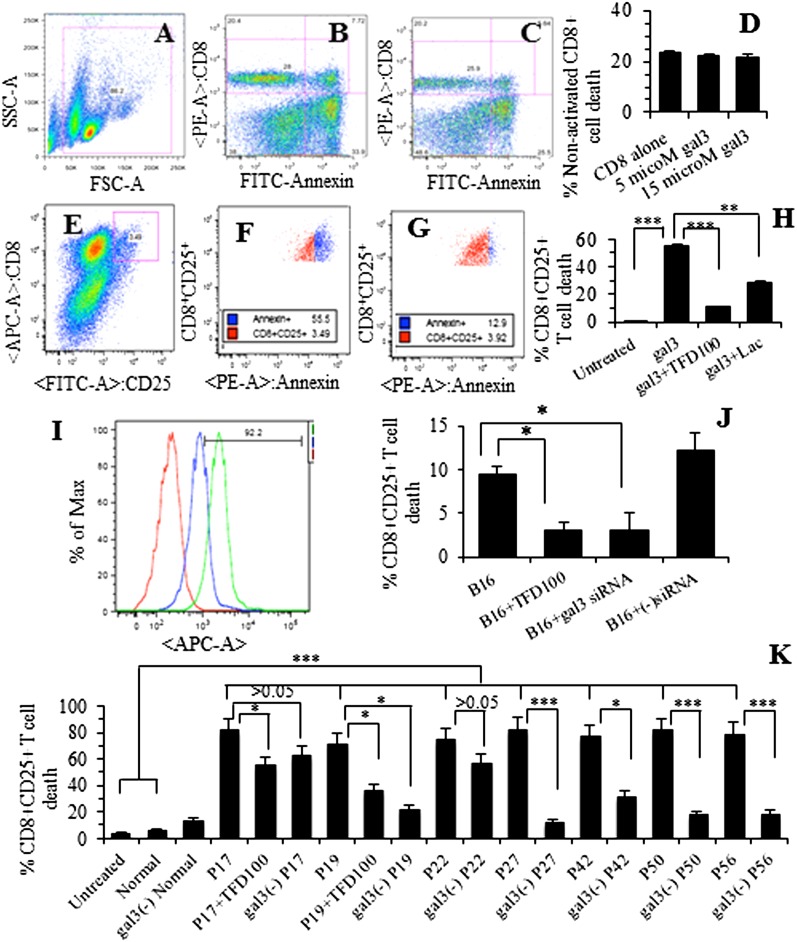
Fig. 5.
Apoptosis of nonactivated CD8+ (A–D) and activated (E–G) CD8+CD25+ T cells. (A) Gating of nonactivated pmel T cells. (B) pmel T cells alone. (C) pmel T cells with gal3 (15 μM). (D) Quantitation showing percent of nonactivated T cells. (E) Gating of pmel activated CD8+CD25+ T cells (shown in red square). (F) Representative cytogram showing apoptosis of pmel activated CD8+CD25+ T cells with gal3 (5 μM). (G) Representative cytogram showing apoptosis of pmel activated CD8+CD25+ T cells with gal3 plus TFD100 (3.5 nM). (H) Quantitation showing percent of activated CD8+CD25+ T cells. (I) Overlay cytograms showing expression of gal3 on B16 melanoma cell surface (red, unstained cells, mean fluorescence unit 214; green, with gal3 Ab, mfu 2832; and blue, with preimmune IgG, mfu 1005. (J) B16 cell-associated apoptosis of pmel activated CD8+CD25+ T cells. Quantitation of B16-mediated apoptosis of pmel activated CD8+CD25+ T cells in the presence of 3.5 nM TFD100 or gal3 siRNA. (K) Apoptosis of activated CD8+CD25+ T cells with gal3-containing or gal3-depleted sera from normal and PCa patients as assessed by annexin V binding. All data are shown as the means ± SD from three determinations. ***P < 0.001; **P < 0.01; *P < 0.05; ANOVA.

