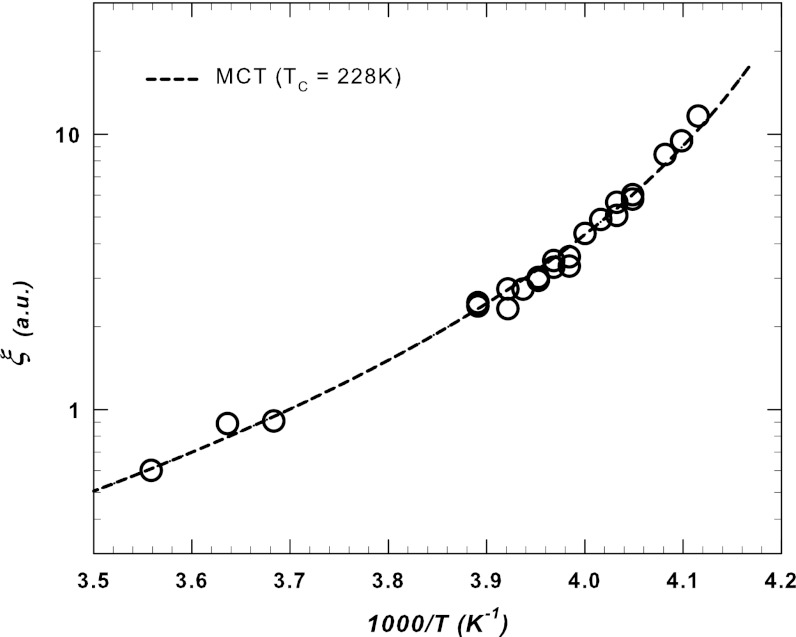
Fig. 4.
The water network correlation length corresponding to the temperature of χT(Q) maxima as a function of 1/T. Dotted line represents the ideal MCT power-law fitting curve with T× = 228 ± 5 K, whereas the exponent is θ ∼ 2. Note that this result is approximately the same as that previously obtained by fitting the anomalous contribution  (23, 24) and the specific heat CP(T) (26) in pure bulk water. Within the framework of extended MCT such a temperature represents the crossover to a water dynamics driven by hopping processes among clusters with a characteristic length proportional to ξ.

