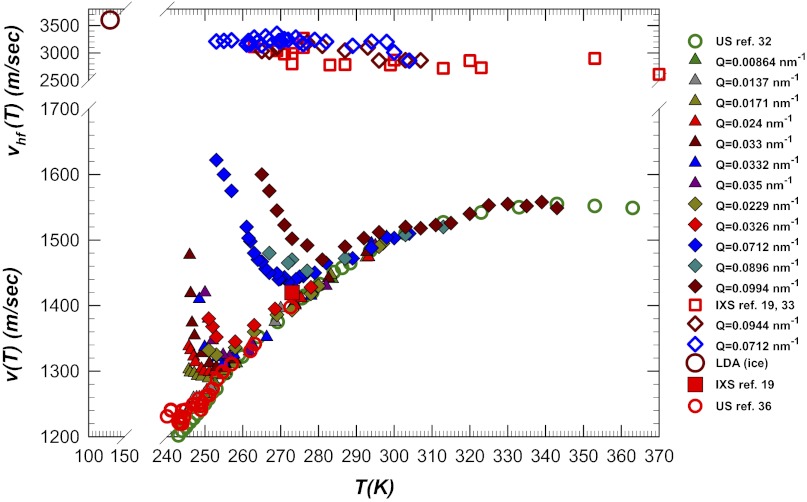
Fig. 5.
The measured viscoelastic behavior of bulk water (sound velocity data). (Bottom) The v(T) data measured using the BS (18, 32) and IUVS (full symbols) (33) techniques at different wave vectors (Q). At the top are the vhf(T) data obtained using IXS (19, 34) and IUVS. The LDA data (large open dark red circles) (37) are also shown for comparison. The US data vus are measured by using the AL technique at 54 kHz (35), the SS technique at 100 MHz (36), and the IXS technique in the THz regime (19, 34). The intermediate ω ranges are measured using BS (1–10 GHz) (18, 32) and IUVS (0.2–100 GHz) (33). For the sake of comparison the value of the longitudinal sound velocity measured in the LDA phase by means of the ultrasound at 5MHz (37) and the values of vus and vhf measured at 273 K using the IXS technique are also shown. Note that the AL data differ slightly from the US data and are, within experimental error, nearly constant when T < 245 K.

