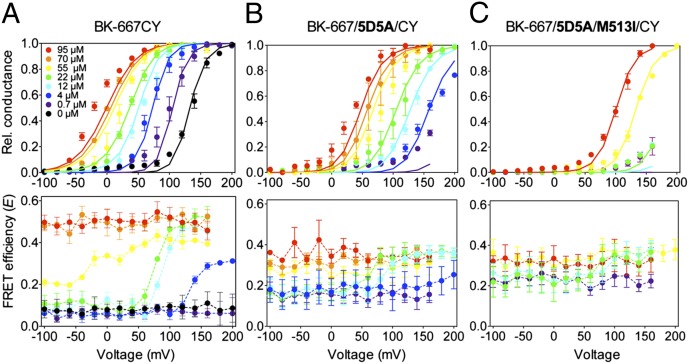
Fig. 4.
Relative movement of the 667 sites is Ca2+ and voltage dependent. G–V curves (Upper) and the corresponding E–V curves (Lower) were determined synchronously at various free Ca2+ concentrations, for (A) BK-667CY heterotetramers, (B) mutants with reduced Ca2+ sensitivity at the Ca2+ bowl (BK-667/5D5A/CY), or (C) mutations at both the Ca2+ bowl and the RCK1 Ca2+ binding site (BK-667/5D5A/M513I/CY). Data are color-coded in all graphs according to free Ca2+ concentrations. The solid lines in A–C (Upper) represent fits to the Sweet and Cox (16) model with parameters shown in Table S1. Data points and error bars represent average ± SEM (n = 3–13).

