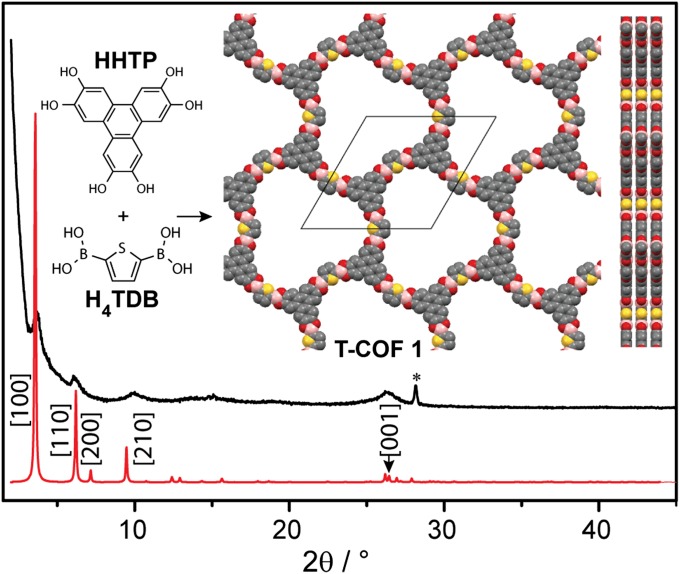
Fig. 1.
Simulated (red) and experimental (black) PXRD patterns of T-COF 1. Inset shows its building blocks and the partial structure viewed normal and parallel to the ab plane. Yellow, red, gray, and pink spheres represent S, O, C, and B atoms, respectively. In Figs. 1 and 4, the asterisks indicate reflection peaks from H3BO3, which is a decomposition product of all T-COFs in the presence of moisture, as verified by 11B MAS NMR δiso = 19.6 ppm (SI Appendix, Fig. S17).

