
Figure 2.
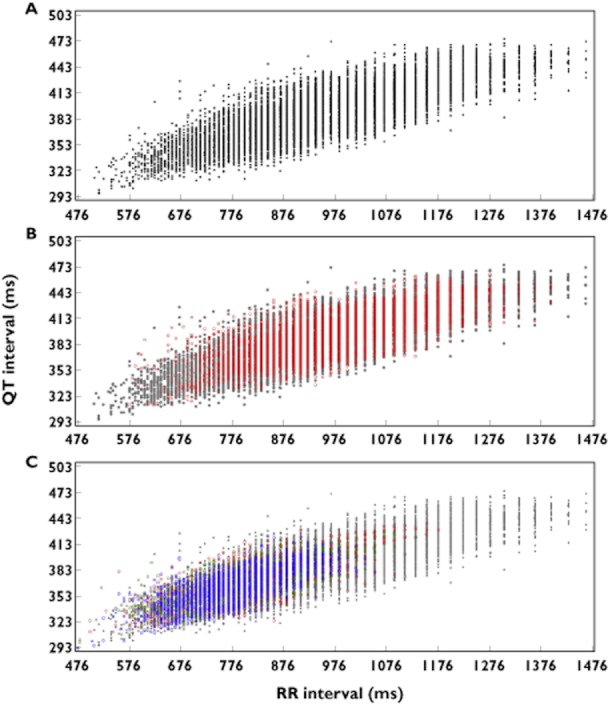
Range of heart rate observations during the pre-therapy period and placebo and exenatide treatment. The range of observed heart rates at pre-therapy (A) and on placebo (B) treatment overlapped with the range observed on exenatide (C).  , pre-therapy (Day −1);
  , placebo;
  , 200 pg ml−1 target exenatide concentration (Day 1);
  , 300 pg ml−1 target exenatide concentration (Day 2);
  , 500 pg ml−1 target exenatide concentration (Day 3)