
Figure 4.
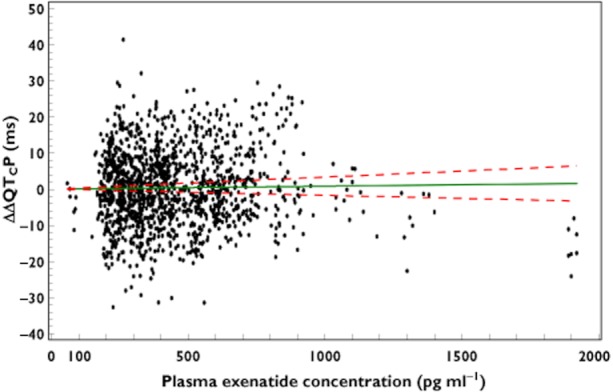
ΔΔQTcP vs. plasma exenatide concentration; Slope (90% CI) = 0.0008 (−0.0017, 0.0033); P = 0.5962; based on a linear mixed effects model with exenatide concentration as covariate, fixed intercept of zero and unknown correlation between subject random intercept and random slope